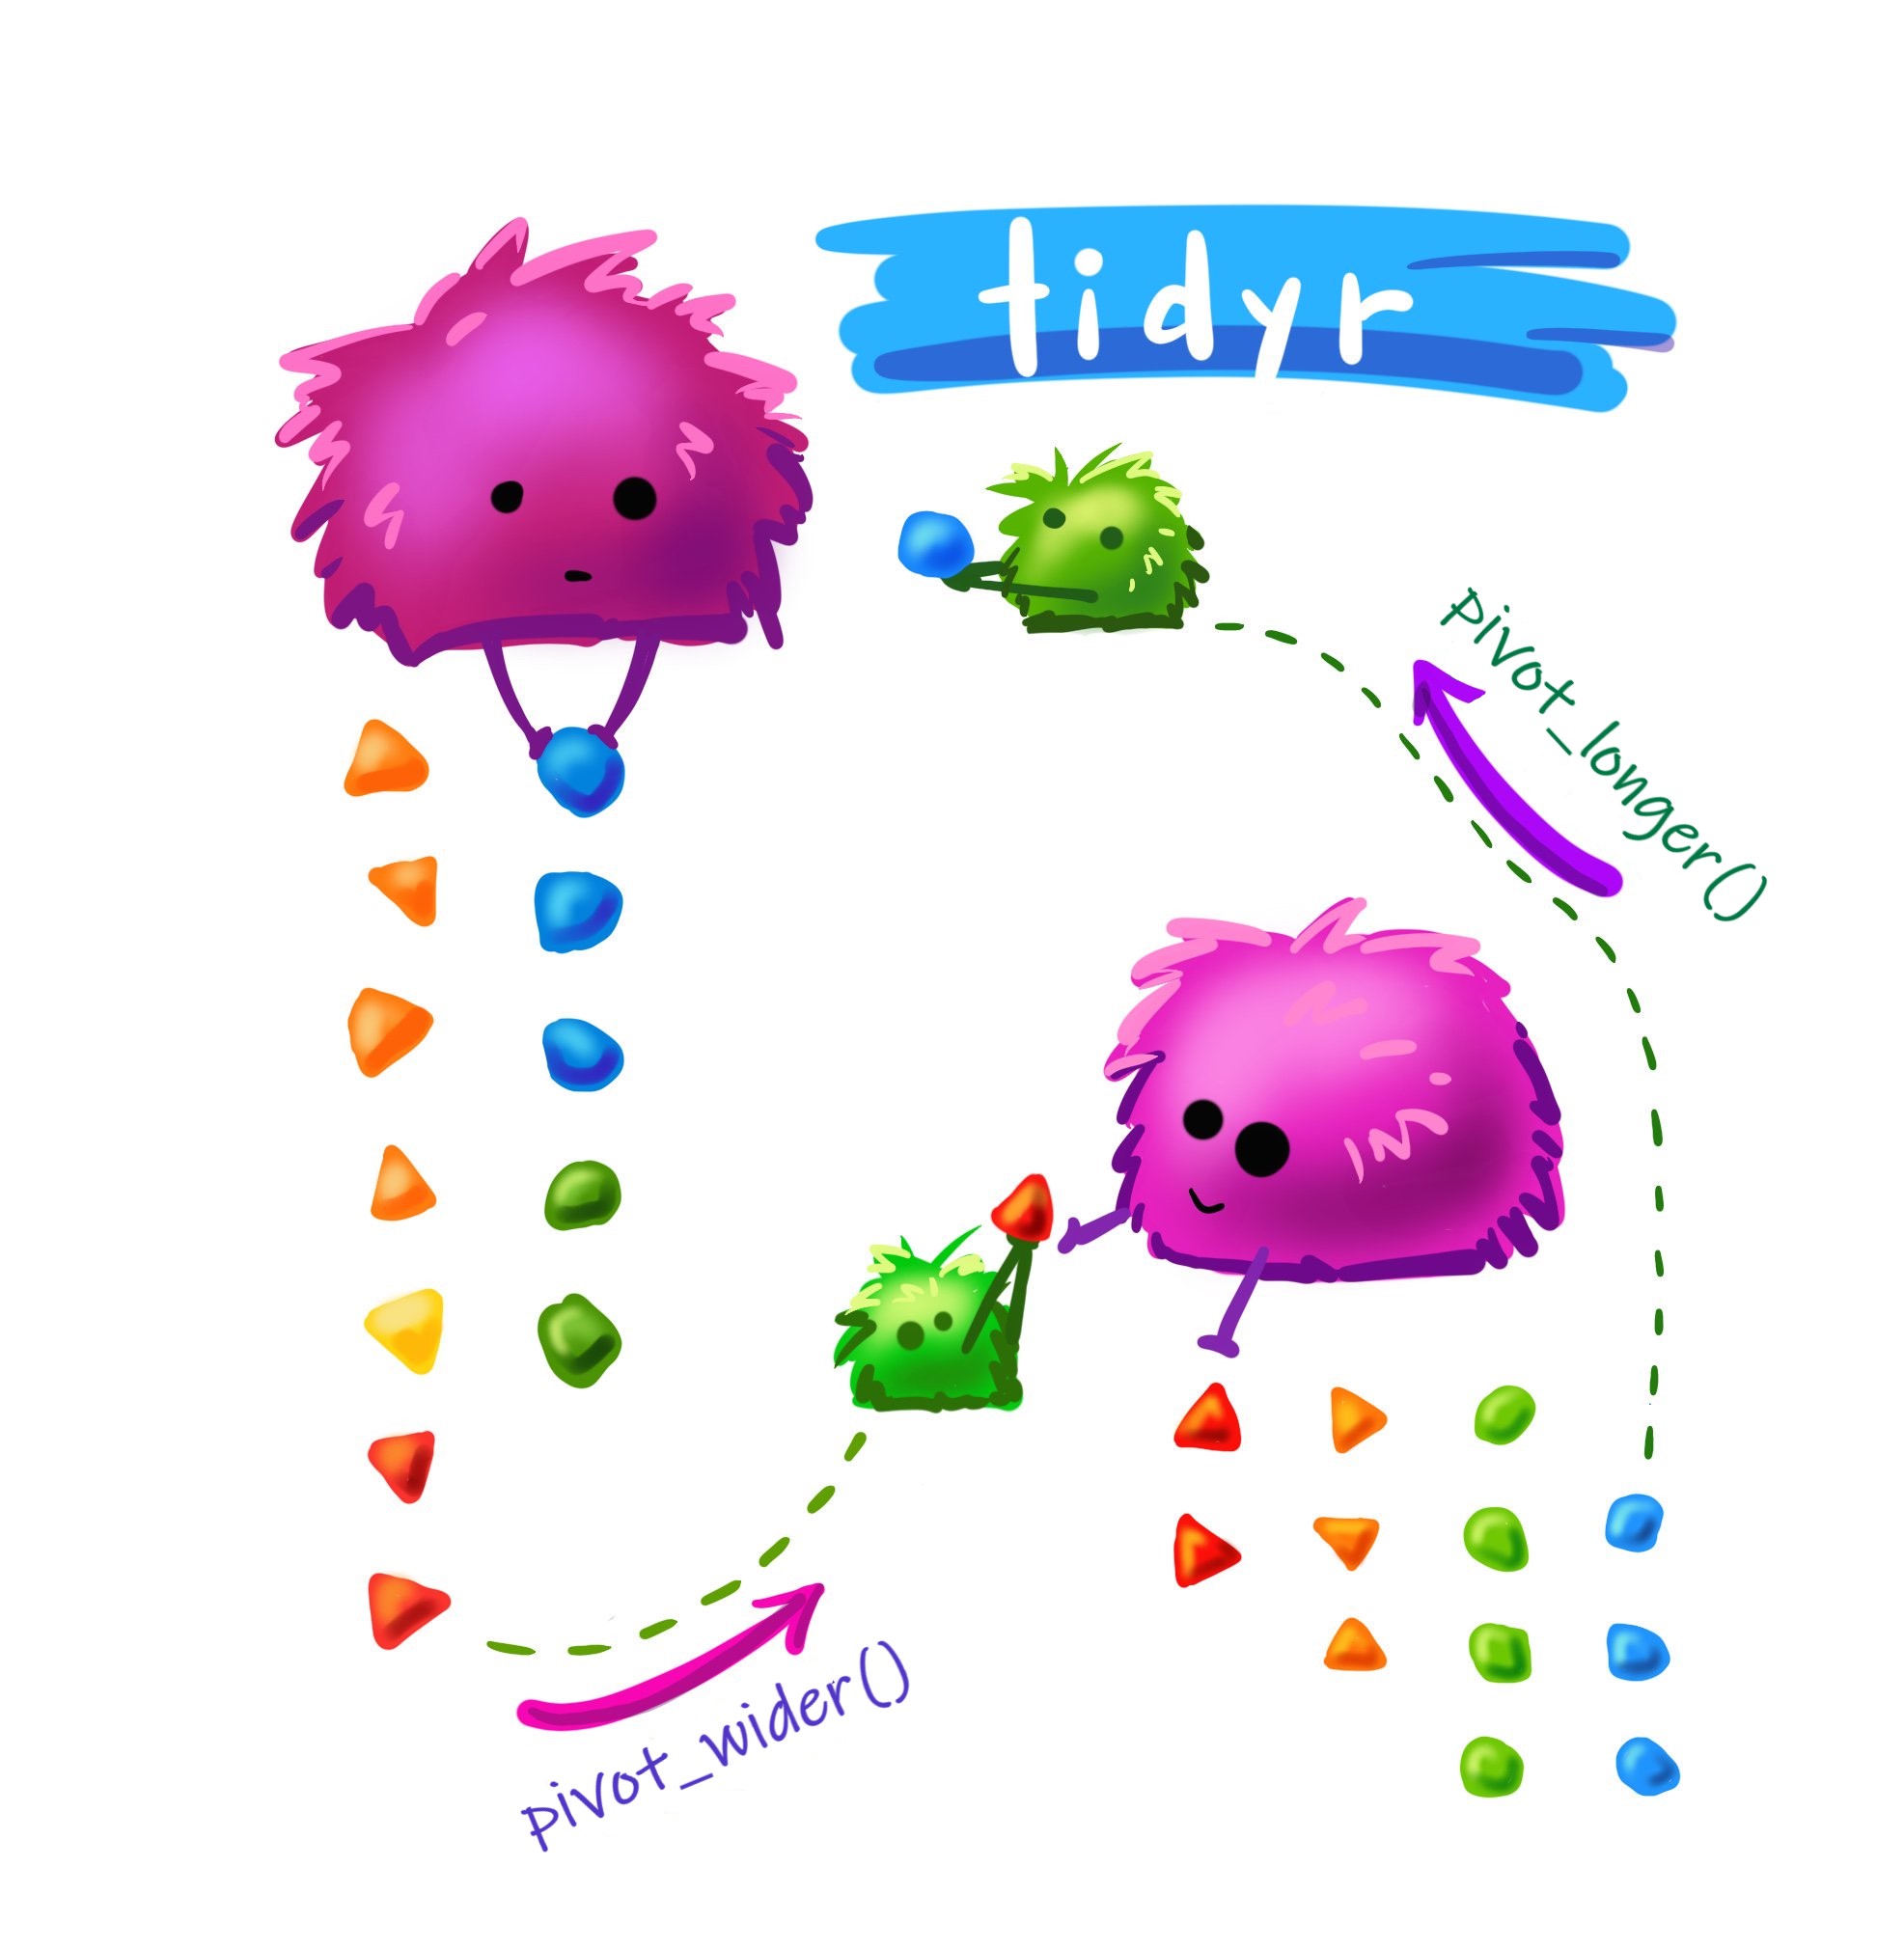
Mastering Data Transformation in R with pivot_longer and pivot_wider
Artwork by: Shannon Pileggi and Allison Horst
Introduction
Data analysis requires a deep understanding of how to structure data effectively. Often, datasets are not in the format most suitable for analysis or visualization. That’s wher...