
Dear rOpenSci friends, it’s time for our monthly news roundup!
You can read this post on our blog.
Now let’s dive into the activity at and around rOpenSci!
rOpenSci HQ
Open Science and Open Source only with Diversity, Equity, Inclusion... [Read more...]
Sign Up for Appsilon’s Tiny Shiny Hackathon: Build, Compete, and Win!
We are excited to invite you to the Appsilon Tiny Shiny Hackathon, a four-hour online challenge where developers can showcase their creativity and technical skills by building applications that combine Shiny and AI. ShinyConf 2025 is coming—are you ready? Join us for an exciting event filled with insights, innovation, and ...

Building LLM-Powered Applications with Shiny for Python: Practical Insights
At Appsilon, we’ve been integrating Large Language Models into Shiny for Python applications for a while now. One thing became clear: the challenge isn’t in the initial integration. Shiny for Python’s ui.Chat component makes that straightforward. The real complexity lies in building applications that can evolve ...

You Don’t Need Airflow: Orchestrate Many Data Flows in R with Maestro
Data never stays in one place for long. Any business or team that works with data needs to be thinking about how data moves from one place to the next. This often happens multiple times, continuously, and in multiple different streams. The conce...

Open Science Mentoring: My Journey with Outreachy Mentees
Bioconductor has been participating in the Outreachy Internship program since 2022. In this post, I, Svetlana Ugarcina Perovic, a senior researcher in microbiome science, share my journey of Outreachy mentoring, detailing my experience with the ...
The Death of Manual Data Analysis? Why AI Won’t Replace You (Yet)
AI is transforming analytics—but not replacing analysts. Here's where AI wins, fails, and how to work with it. [Read more...]
Scaling Decision Support Systems: When to Use React, Python, and R
In the past, many organizations relied on static file reports to make decisions. Typically, several Excel and PowerPoint reports are generated each month. Management would gather, discuss results, decide, and move to email other systems or meet with their teams to pass these decisions forward. There are multiple problems with ...

Shiny Gathering x Pharmaverse Recap: Simplifying R Package Quality with the {riskassessment} App
Customizing the {riskassessment} App based on your organization’s needs makes validating R packages in regulated industries like pharma more efficient and compliant. Strict compliance rules and best practices mean organizations need a reliable way to assess and approve packages. The {riskassessment} App, built on {riskmetric}, provides a structured, user-friendly ...

Introduction to Empirical Macroeconomics with R workshop
Join our workshop on Introduction to Empirical Macroeconomics with R, which is a part of our workshops for Ukraine series! Here’s some more info: Title: Introduction to Empirical Macroeconomics with R Date: Thursday, March 20th, 14:00 – 16:00 CET (Rome, Berlin, Paris timezone) Speaker: Xiaolei (Adam) Wang is an Economics PhD student ... [Read more...]
Political ideology and DOGE layoffs
This post reproduces Dr. Adam Bonica's analysis into the relationship between the ideological alignment of government agencies and the targeting of layoffs by the Department of Government Efficiency (DOGE).

Checking your R packages and practicals on a schedule using GitHub Actions
Introduction
Do you have a R package that’s just on GitHub? How often do you check it? CRAN follows a rolling release model, so any day one of your package’s dependency packages could be updated - breaking your package!
Or maybe you teach a...
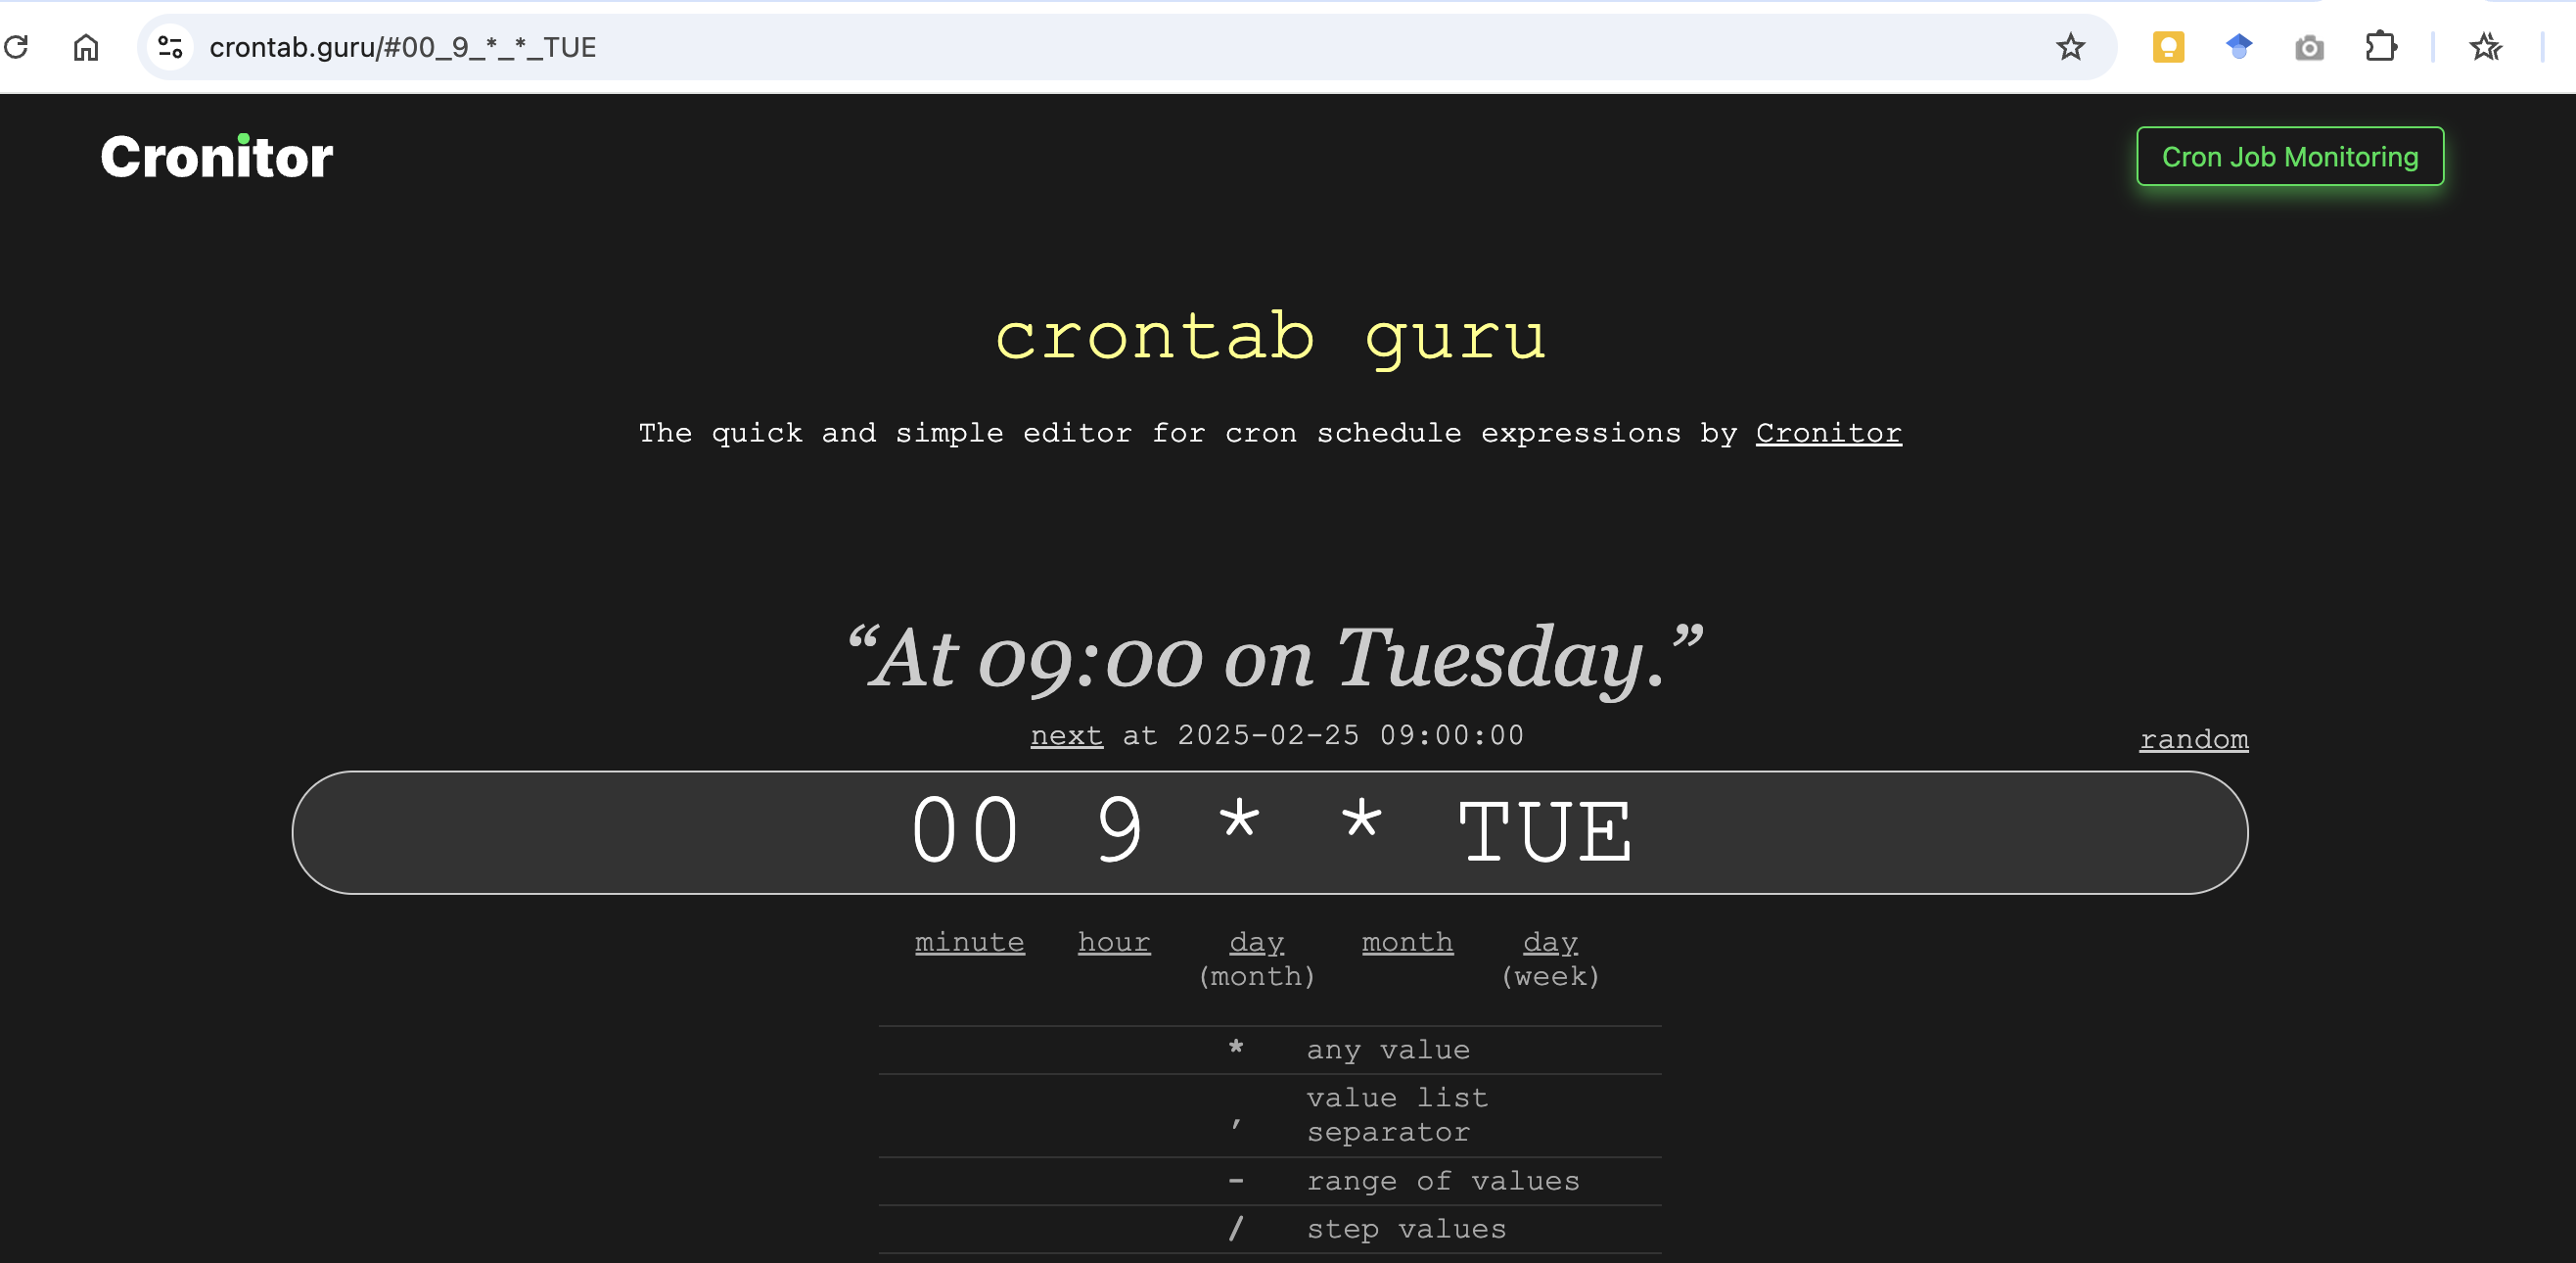
Demystifying geom_bar() – How ggplot2 Automatically Counts and Transforms Data
ggplot2 is a powerful and well-known data visualization package for R. But do you know what gg stands for? It actually refers to the Grammar of Graphics, a conceptual framework for understanding and constructing graphs. The core idea behind the Gramm...
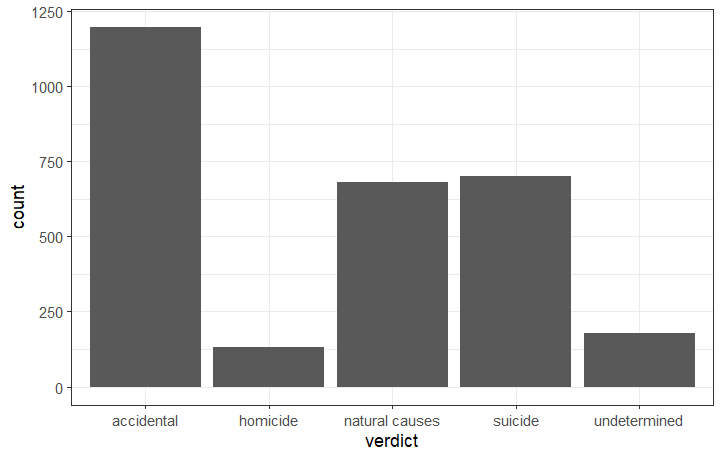
How to Set the Initial Zoom and Position of Geographic Maps
Sometimes the geographic map visualization is not initially centered or zoomed into the preferred level. This article will show you how to customize the initial...
Web app with DeepSeek R1 and Hugging Face API for chatting
Demo usage of DeepSeek R1 and Hugging Face API for chatting [Read more...]
How to Create a Correlation Matrix in R
A correlation matrix is a table of correlation coefficients for a set of variables used to determine if a relationship exists between the variables. The...

Analytics Link Roundup, Feb. 17–21
During the week, I often collect and share links I find
interesting on Elder Research’s Slack. I shared a short list
on LinkedIn and reproduce it here.
A short link roundup for this week:
More writing about LLMs and pr... [Read more...]
Calling Python from C# using Python.NET
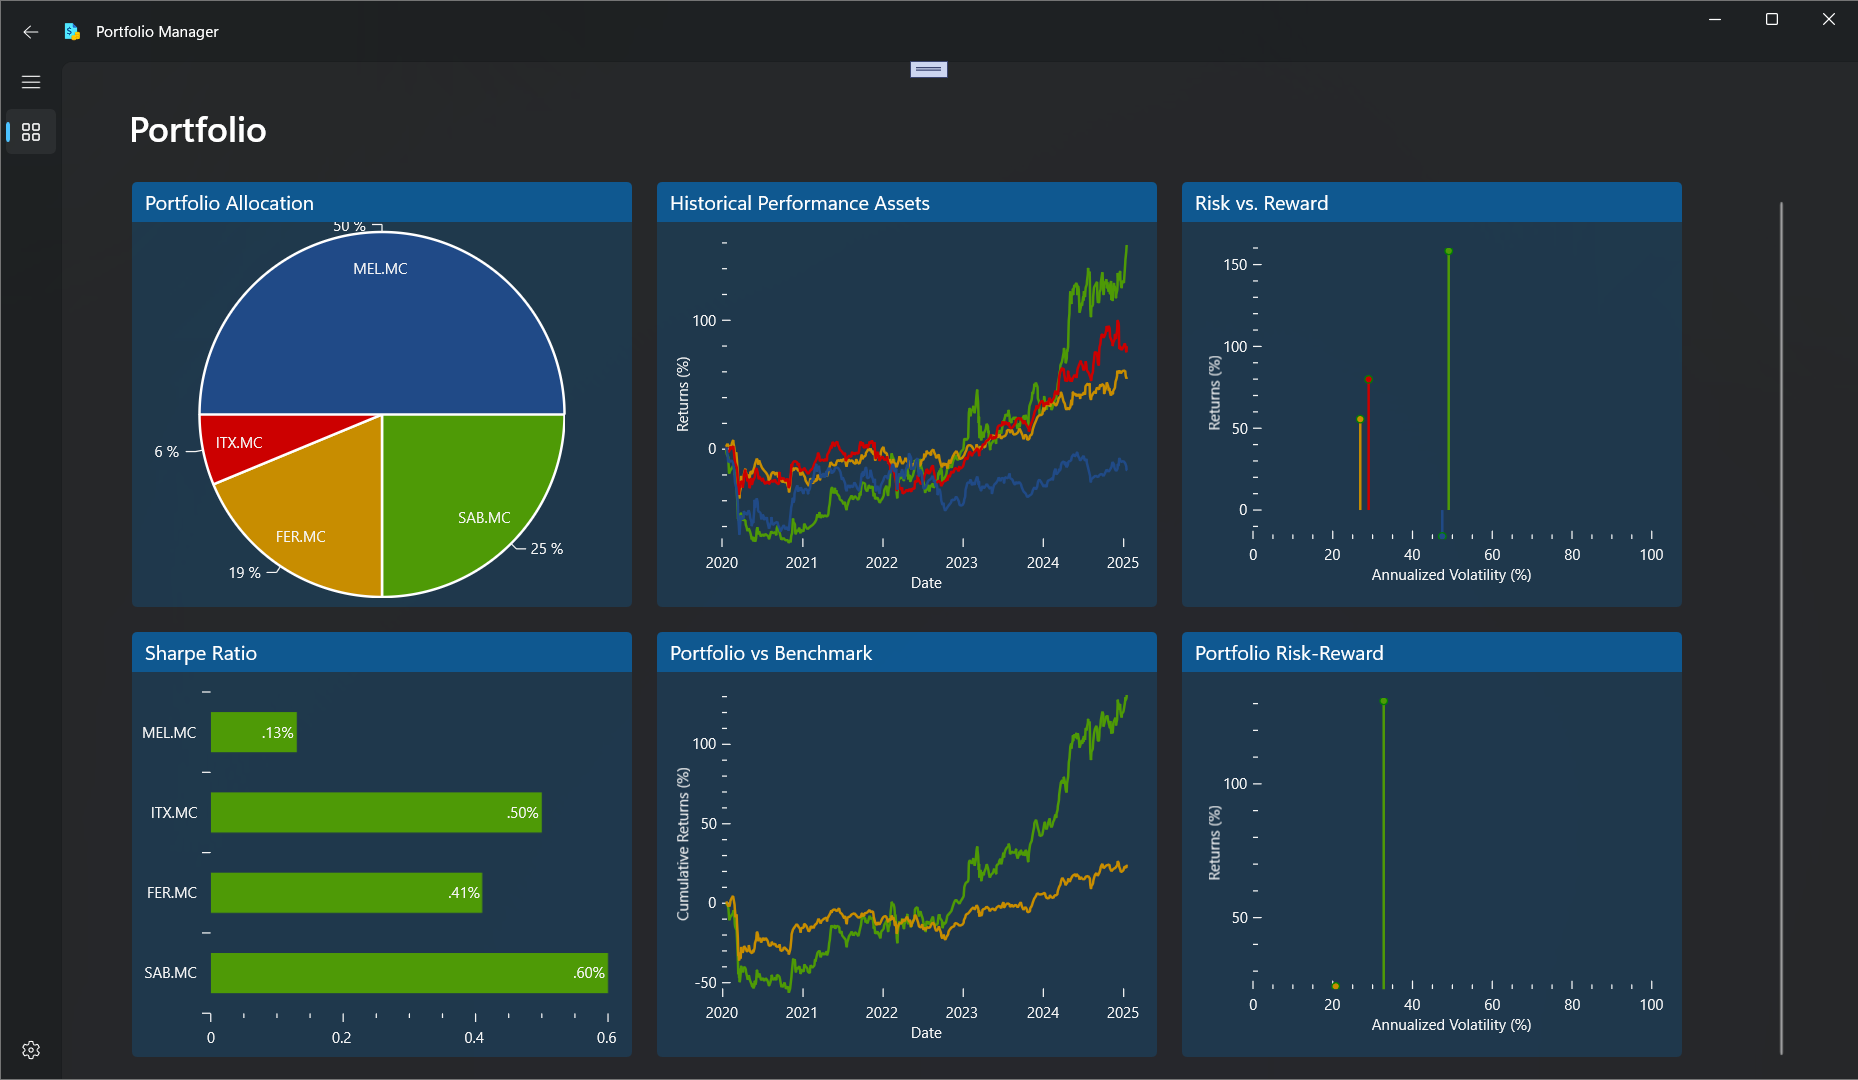
Recently, I've been using Python's __yfinance__ library to perform some simple portfolio analysis. Rather than using a Jupyter notebook to run the Python code and visualise the results, I thought it might be a nice idea to build a .NET desktop application using WinUI 3.0, XAML and C#. The application allows ...
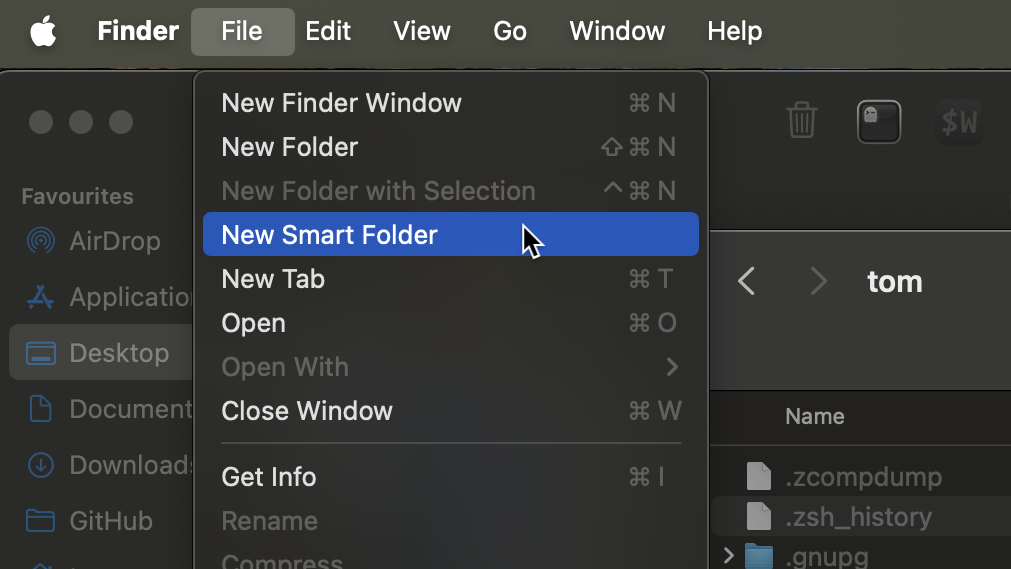
Creating a Finder Smart Folder of your RStudio Project files to enable super fast project launching
Introduction
When I’m switching projects I naturally start with Finder. I’m sure if I became a Terminal warrior there are faster ways of searching for files (e.g. the
Television fuzzy finder TUI). And I know there are other ways to avoid u...
The Dynamic Relationship of Forks with their Upstream Repository
Context setting
rOpenSci organizes monthly co-working hours on a variety of topics.
But the constant is the quality of the discussion that ensues and the renewed energy that comes from it.
The November coworking session welcomed Stefanie Butland from... [Read more...]
Building a portfolio with Github and Quarto
The slides for the talk given for the CUNY SPS Data Science and Information Systems department are below. The example website can be viewed here and the repository containing the code to generate the website is here.
View slides in full scre... [Read more...]
Copyright © 2026 | MH Corporate basic by MH Themes