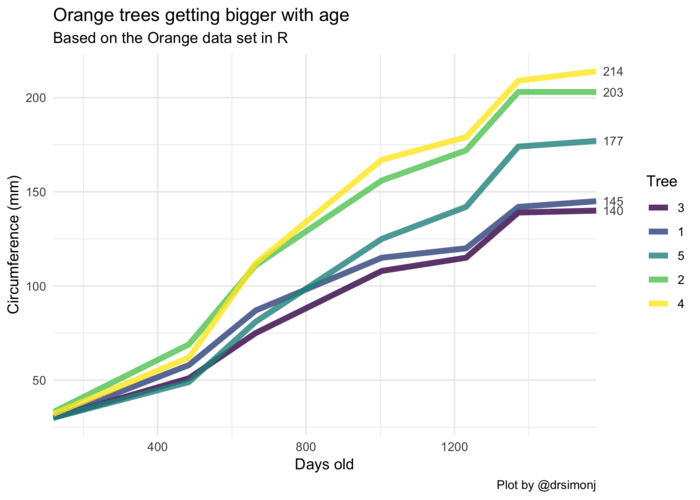
Label line ends in time series with ggplot2
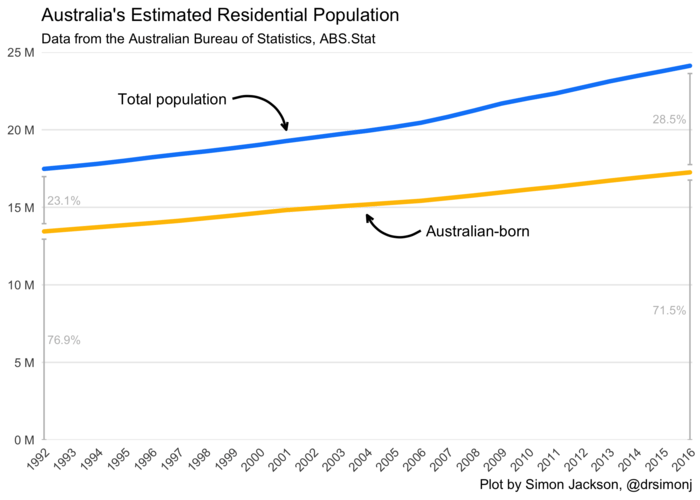
@drsimonj here with a quick share on making great use of the secondary y axis with ggplot2 – super helpful if you’re plotting groups of time series!
Here’s an example of what I want to show you how to create (pay attention to the numbers of the ...