Articles by schochastics

Using a Quarto Dashboard for GitHub Wrapped

December 17, 2023 | schochastics

Dashboards are coming to Quarto in version 1.4. I already gave them a spin for a simple parking dashboard but felt like they deserve some bigger attention. Given its the time of year where many platforms offer a personal “recap”, like spotify or twi... [Read more...]

Efficient row min calculation: From R to C

November 15, 2023 | schochastics

My colleague Chung-hong Chan started a new package in our teams GitHub organization. An issue there caught my attention. The performance was very slow of the main function. The issue lay somewhere in the auxiliary functions. This lead me down quite ... [Read more...]

Create a CV with Quarto

July 16, 2023 | schochastics

In this post, I will introduce a few extensions for Quarto to create nicely looking CVs. Disclaimer: the underlying templates where not created by me but where adopted from these LaTeX templates for CVs and resumes and this modern Latex CV. Creating... [Read more...]

Fast creation of LFR Benchmark graphs in R

June 27, 2023 | schochastics

Almost a year ago, I introduced my most recent network related R packages netUtils. The package is meant as a catch-all package where I gather network analytic methods that haven’t yet been implemented in R and may not deserve there own package. Bet... [Read more...]

rang: make ancient R code run again

February 15, 2023 | schochastics

Reproducibility is a big issue in the (computational) world of science. Code that runs today might not run tomorrow because packages are updated, functions deprecated or removed, and whole programming languages change. In the case of R, there exist ... [Read more...]

Extending network analysis in R with netUtils

August 26, 2022 | schochastics

During the last 5 years, I have accumulated various scripts with (personal) convenience functions for network analysis and I also implemented new methods from time to time which I could not find in any other package in R. The package netUtils gathers all these functions and makes them available for anyone ... [Read more...]

Academicons: my first quarto extension

July 16, 2022 | schochastics

I have been following the development of quarto for a while now and I am pretty excited about it. Not only its features but also its rich and detailed documentation will make me transition from Rmarkdown to Quarto in the long run. While moving my personal webpage, I realized though ... [Read more...]

Sketchy, Hand-drawn-like Maps in R

December 7, 2021 | schochastics

This post introduces the R package rougsf, which wraps the java script library rough.js to draw sketchy, hand-drawn-like maps. The package was born out of the 30DayMapChallenge which I participated in this year. #install.packages("remotes&qu... [Read more...]

Animating Network Evolutions with gganimate

September 14, 2021 | schochastics

People regularly ask me if it is possible to animate a network evolution with {{ggraph}} and {{gganimate}}. Unfortunately this is not yet possible. But fear not! There is a way to still get it done with some hacking around the ggraph package. In th... [Read more...]

Raspberry Pi E-Paper Dashboard with R

October 15, 2020 | schochastics

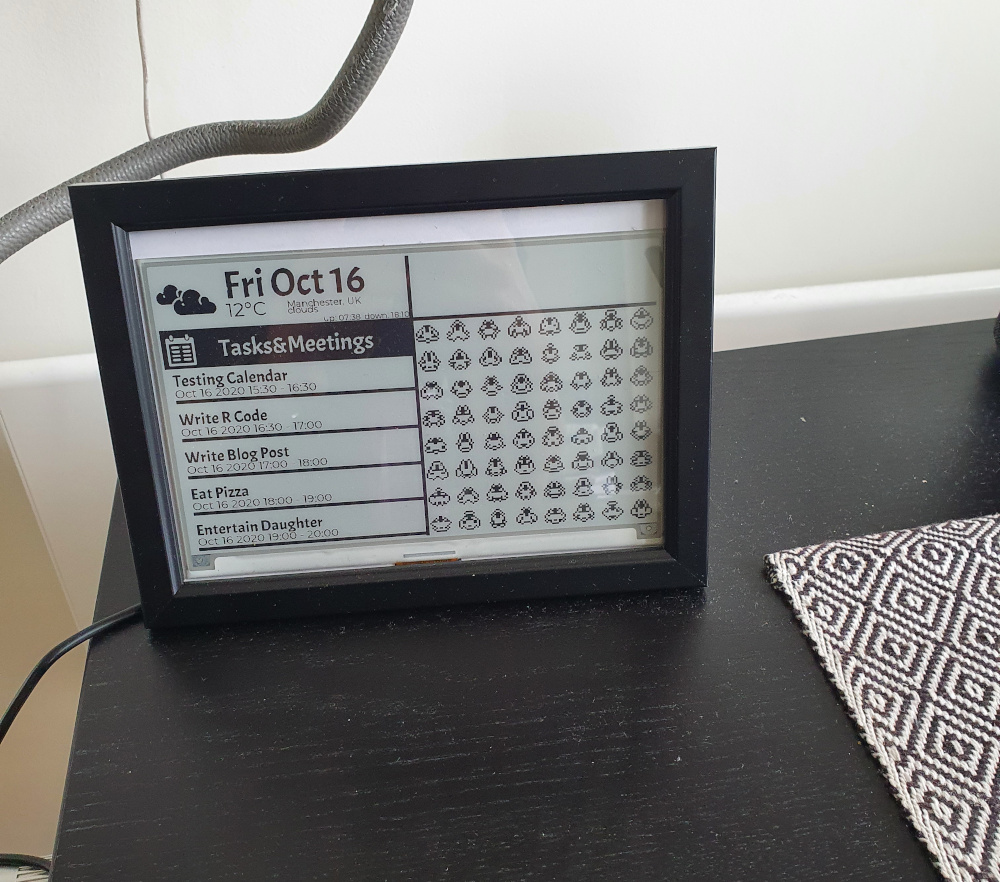
For once, this is not a post on an R package for network analysis or random R code. This post is about a DIY adventure of mine with a little R code on the side. I have always been intrigued by the Raspberry Pi, but never really engaged with it ...
[Read more...]

Sketchy, Hand-drawn-like Networks in R

August 22, 2020 | schochastics

This post introduces the R package rougnet, which wraps the java script library rough.js to draw sketchy, hand-drawn-like networks. From all my network packages, this is probably the most useless but most fun one I developed. The package is so far only available on github, but it already has ... [Read more...]

Visualizing Multilevel Networks with graphlayouts

April 25, 2020 | schochastics

This post introduces layout_as_multilevel(), a new function in the {{graphlayouts}} package. As the name suggests, this function can be use to visualize multilevel networks. A multilevel network consists of two (or more) levels with different node sets and intra-level ties. For instance, one level could be scientists and ... [Read more...]

Posts

March 13, 2020 | schochastics

[This article was first published on schochastics, and kindly contributed to R-bloggers]. (You can report issue about the content on this page here) Want to share your [Read more...]

ggraph tricks for common problems

March 13, 2020 | schochastics

In this post I am going to share some bits of code for some common problems that I encountered with {{ggraph}}. By problems, I do not mean problems in the package. Rather, I mean the things you want to do, that require going a little beyond the standard use cases. ... [Read more...]
1 2 3

Never miss an update!
Subscribe to R-bloggers to receive
e-mails with the latest R posts.
(You will not see this message again.)

Click here to close (This popup will not appear again)