Articles by Sascha W.

Rcrastinate is moving.

January 18, 2019 | Sascha W.

Hi all, this is just an announcement.I am moving Rcrastinate to a blogdown-based solution and am therefore leaving blogger.com. If you're interested in the new setup and how you could do the same yourself, please check out the all shiny and new Rcrasti...
[Read more...]

Substitute levels in a factor or character vector

October 27, 2017 | Sascha W.

I've been using the ggplot2 package a lot recently. When creating a legend or tick marks on the axes, ggplot2 uses the levels of a character or factor vector. Most of the time, I am working with coded variables that use some abbreviation of the "true" meaning (e.g. "f" ... [Read more...]

Plotting GPX tracks with Shiny and Leaflet

August 5, 2016 | Sascha W.

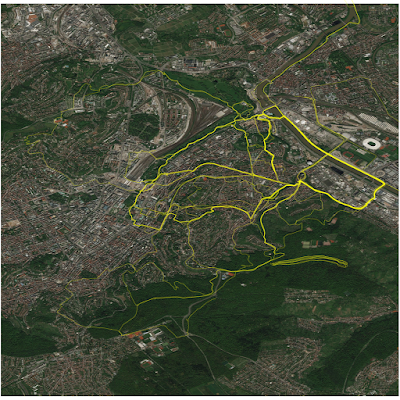
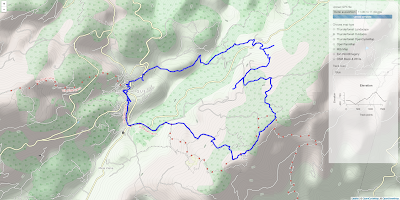
Lately, I got the chance to play around with Shiny and Leaflet a lot - and it is really fun! So I decided to catch up on an old post of mine and build a Shiny application where you can upload your own GPX files and plot them directly in ...
[Read more...]

Visualisation of Likert scale results

July 31, 2016 | Sascha W.

I wrote a function to visualise results of Likert scale items. Please find the function below the post. Here is an example plot:The function is called 'plot.likert' and takes the following arguments:- vec: The vector with the raw results- possible.values: A vector with all the possible ...
[Read more...]

Visualisation of Likert scale results

July 31, 2016 | Sascha W.

[EDIT: The function now also inludes the possibility to plot the IQR around the median. I shifted the median slightly downwards to prevent the SD and the IQR from overlapping.]I wrote a function to visualise results of Likert scale items. Please find the function below the post. Here is ...
[Read more...]

Just plot this…

April 25, 2016 | Sascha W.

png("goodbye.png", height = 625, width = 500)par(col = "purple")plot(1, 1, xlim = c(0,800), ylim = c(0,1600), type = "n", bty = "n", xaxt = "n", yaxt = "n", xlab = "", ylab = "")symbols(x = 400, y = 1200, circles = 400, add = T, lwd = 40)lines(x = c(40... [Read more...]
1 2 3

Never miss an update!
Subscribe to R-bloggers to receive
e-mails with the latest R posts.
(You will not see this message again.)

Click here to close (This popup will not appear again)