Articles by Sam Weiss

Dynamic Networks: Visualizing Arms Trades Over Time

June 14, 2017 | Sam Weiss

I previously made some network graphs of Middle East country relationships here using Slate's Middle East Friendship Chart. I was thinking of a way to visualize these relationships (and possibly other ones) with more rule based and objective measure over time. What kind of public dataset could show countries relationships ...
[Read more...]

Economist Liquidity Index

June 7, 2016 | Sam Weiss

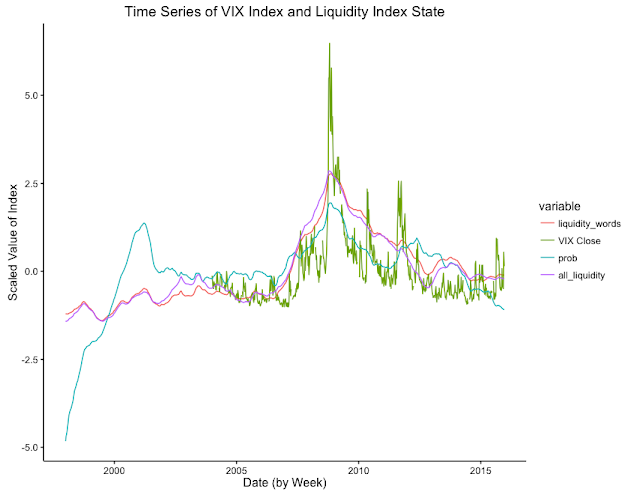
IntroductionA typical article that discusses economics is awash with words that allude economics connection with water or a liquid. For Example: Markets get saturated when a competing country dumps its products on them Stock prices can get frothy and might develop into a bubble A credit squeeze will dampen expectations ...
[Read more...]

When the Predictions are more accurate than the Response

May 15, 2016 | Sam Weiss

The purpose of this post is to discuss the methodology of classifying paragraphs of documents, where the document is only assigned one topic. In my usage, a document is an article that is assigned a Section (Business, Economics / Finance, Science, Europe, Middle East, etc). Of course each article can have ... [Read more...]

Are Turbocharged Engines More Fuel Efficient?

January 11, 2016 | Sam Weiss

Introduction:My previous post discussed methods to uncover effects of a particular explanatory variable on a response variable in machine learning models. These work by changing the variable of interest and measure how much the change in output, is kee... [Read more...]

Sampling Arbitrary data

January 3, 2016 | Sam Weiss

Introduction:Generating data usually requires a variance - covariance matrix and is therefore restricted by using a linear assumption between the variables. However, using a linear assumption between data can miss important non - linear relationships. ... [Read more...]

Slate Middle East Graph #2

October 7, 2015 | Sam Weiss

I recently saw Slate.com redid its Mideast Graphic and thought it would be good to redo my previous analysis. From the original slate graphic it's hard to make much sense of what's happening and who's friends with whom.From the graph below we can ... [Read more...]

Western Front Battle Exchange Rates

March 22, 2015 | Sam Weiss

Introduction:GithubThe Western Front in World War One is considered a a war of outdated tactics combined with brutal efficiency of technology. And while the war saw the introduction of several innovations (eg. tanks and airplanes) the general routine o... [Read more...]

Mideast Graph 3: Slate Middle East Friendship

July 23, 2014 | Sam Weiss

Slate recently published a great info-graphic about Middle-East Relationships. It shows the relationships (Friend, Enemy, or Complicated) of 13 countries / organizations and the relationships between each pair. One draw back of the chart is that it doe... [Read more...]

Modeling "This Time is Different" in R

April 14, 2014 | Sam Weiss

Check out PDF for Equations And Code to run yourself Introduction: “This Time is different” by Reinhart and Rogoff is an empirical history of financial crises and panics.  It describes many economic events such as; inflation, bubbles, and defaults. The theme that ties these events together is the idea that ... [Read more...]

Modeling "This Time is Different"

April 14, 2014 | Sam Weiss

Check out PDF for Equations And Code to run yourself Introduction: “This Time is different” by Reinhart and Rogoff is an empirical history of financial crises and panics.  It describes many economic events such as; inflation, bubbles, and defaults. The theme that ties these events together is the idea that ... [Read more...]

Never miss an update!
Subscribe to R-bloggers to receive
e-mails with the latest R posts.
(You will not see this message again.)

Click here to close (This popup will not appear again)