Articles by sabir

R Color

July 20, 2022 | sabir

We can visually improve our plots by coloring them. This is generally done with the col graphical parameter. We can specify the name of the color we want as a string. For example, if we want our plot to be a red color, we pass col = "red".... [Read more...]

R Functions

July 19, 2022 | sabir

Introduction to R Functions A function is just a block of code that you can call and run from any part of your program. They are used to break our code in simple parts and avoid repeatable codes. You can pass data into functions with the help of pa... [Read more...]

R repeat Loop

July 19, 2022 | sabir

We use the R repeat loop to execute a code block multiple times. However, the repeat loop doesn't have any condition to terminate the lYou can use the repeat loop in R to execute a block of code multiple times. However, the repeat loop does not have any condition to ... [Read more...]

R break and next

July 19, 2022 | sabir

We use the R break and next statements to alter the flow of a program. These are also known as jump statements in programming: break - terminate a looping statement next - skips an iteration of the loop R break Statement You can use a break statement inside a loop (... [Read more...]

R Matrix

July 18, 2022 | sabir

A matrix is a two-dimensional data structure where data are arranged into rows and columns. For example, {IMAGE: 2 * 3 matrix with integer data} Here, the above matrix is 2 * 3 (pronounced "two by three") matrix because it has 2 rows and 3 columns. Create a Matrix in R In R, we use the matrix() function ... [Read more...]

R Read and Write xlsx Files

July 18, 2022 | sabir

An xlsx is a file format used for Microsoft Excel spreadsheets. Excel can be used to store tabular data. R has built-in functionality that makes it easy to read and write an xlsx file. Sample xlsx File To demonstrate how we read xlsx files in R, let's suppose we have ... [Read more...]

R Read and Write CSV Files

July 18, 2022 | sabir

The CSV (Comma Separated Value) file is a plain text file that uses a comma to separate values. R has a built-in functionality that makes it easy to read and write a CSV file. Sample CSV File To demonstrate how we read CSV files in R, let's suppose we have ... [Read more...]

R strip Chart

July 18, 2022 | sabir

A strip chart is a type of chart that displays numerical data along a single strip. A strip chart can be used to visualize dozens of time series at once. Dataset to Create Strip Chart In R, first we need to load the dataset of which we want to ... [Read more...]

R Boxplot

July 18, 2022 | sabir

A boxplot is a graph that gives us a good indication of how the values in the data are spread out. Box plots provide some indication of the data's symmetry and skew-ness. Dataset to Create Boxplot In R, first we need to load the dataset of which we want to ... [Read more...]

R Pie Chart

July 18, 2022 | sabir

A pie chart is a circular statistical graphic, which is divided into slices to illustrate numerical proportion. Pie charts represents data visually as a fractional part of a whole, which can be an effective communication tool. Create Pie Plot in R... [Read more...]

R Histogram

July 18, 2022 | sabir

A histogram is a graphical display of data using bars of different heights. Histogram is used to summarize discrete or continuous data that are measured on an interval scale. Create Histogram in R In R, we use the hist() function to create Histog... [Read more...]

R Date

July 18, 2022 | sabir

Depending on what purposes we're using R for, we may want to deal with data containing dates and times. R Provides us various functions to deal with dates and times. Get Current System Date, and Time in R In R, we use Sys.Date(), Sys.time() to get the current ... [Read more...]

R Percentile

June 20, 2022 | sabir

A percentile is a statistical measure that indicates the value below which a percentage of data falls. For example, the 70th percentile is the value below which 70% of the observations may be found. Calculate Percentile in R In R, we use the quan... [Read more...]

R min() and max()

June 20, 2022 | sabir

In R, we can find the minimum or maximum value of a vector or data frame. We use the min() and max() function to find minimum and maximum value respectively. The min() function returns the minimum value of a vector or data frame. The max() func... [Read more...]

R Factors

June 20, 2022 | sabir

A Factor is a data structure that is used to work with categorizable datas. Suppose a data field such as marital status may contain only values from single, married, separated, divorced, or widowed. In such a case, we know the possible values beforehand and these predefined, distinct values are called ... [Read more...]

R Data Frame

June 20, 2022 | sabir

A data frame is a two-dimensional data structure which can store data in tabular format. Data frames have rows and columns and each column can be a different vector. And different vectors can be of different data types. Before we learn about Data F... [Read more...]

R Array

June 20, 2022 | sabir

An Array is a data structure which can store data of the same type in more than two dimensions. The only difference between vectors, matrices, and arrays are Vectors are uni-dimensional arrays Matrices are two-dimensional arrays Arrays can have more than two dimensions Before we learn about arrays, make sure ... [Read more...]

R List

June 20, 2022 | sabir

A List is a collection of similar or different types of data. In R, we use the list() function to create a list. For example, # list with similar type of data list1 [Read more...]

R Vectors

June 16, 2022 | sabir

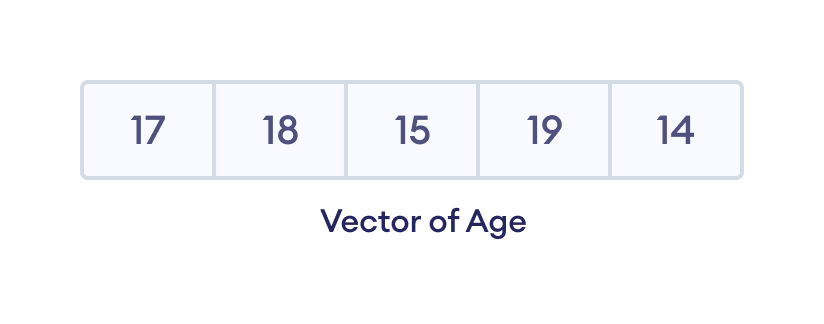
A vector is the basic data structure in R that stores data of similar types. For example, Suppose we need to record the age of 5 employees. Instead of creating 5 separate variables, we can simply create a vector. Elements of a Vector Create a Ve...
[Read more...]

R Strings

June 13, 2022 | sabir

A string is a sequence of characters. For example, "Programming" is a string that includes characters: P, r, o, g, r, a, m, m, i, n, g. In R, we represent strings using quotation marks (double quotes, " " or single quotes, ' '). For example, # string value using single quotes 'Hello' # ... [Read more...]

Never miss an update!
Subscribe to R-bloggers to receive
e-mails with the latest R posts.
(You will not see this message again.)

Click here to close (This popup will not appear again)