Articles by rstats-tips.net

Simple Prediction in SARS-CoV-2 Shiny App

February 27, 2021 | rstats-tips.net

I made another small update to my SARS-CoV-2 Shiny App. As the discussion in Germany about whether to open schools and shops starts again 
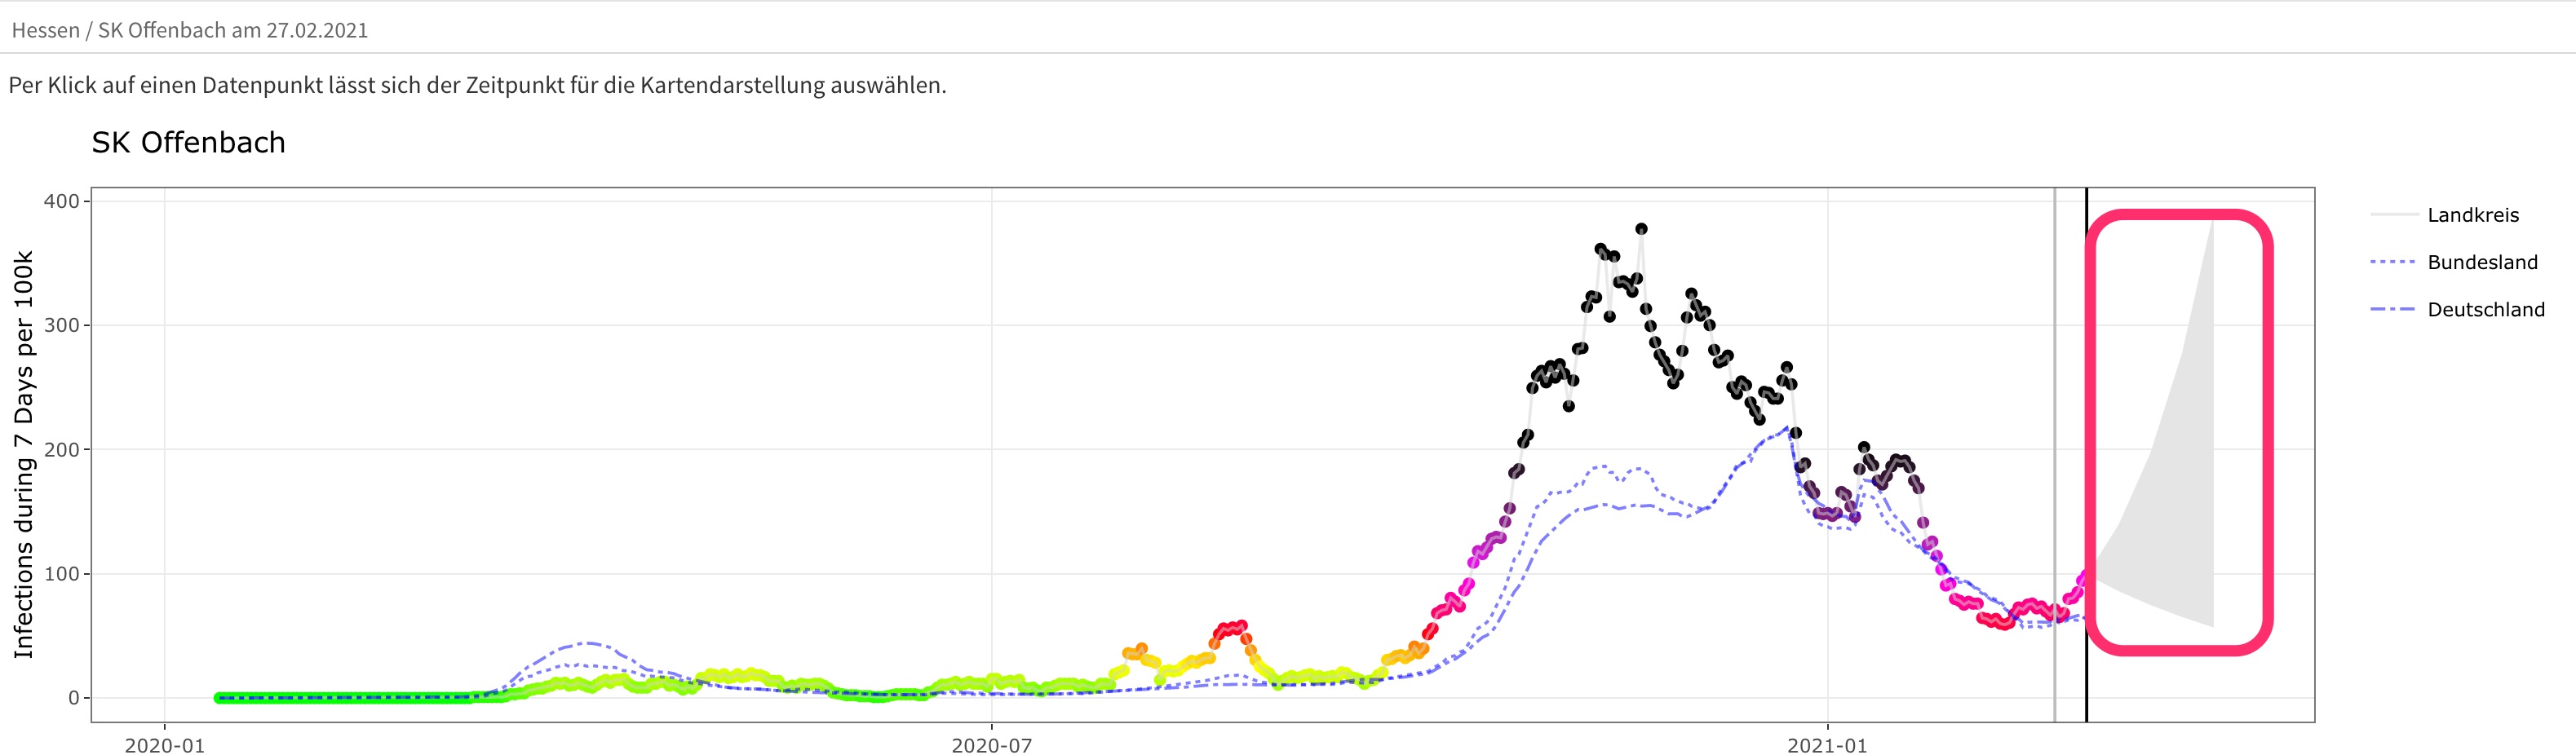
I was wondering how I could visualize a simple prediction of future infections. So I did the following simple appr...
[Read more...]

Updated SARS-CoV-2 Shiny App

January 22, 2021 | rstats-tips.net

I’ve updated my Shiny App slightly. Because of the appearence of the mutation B 1.1.7 I want to see the current R-value, the current reproduction rate of the virus per Landkreis or Bundesland. The scientists suspect that B 1.1.7 has a 50% higher...
[Read more...]

Anomaly Detection with Prophet

December 31, 2020 | rstats-tips.net

How to detect the unexpected? Is the behaviour of some measured value normal or did something unexpected happen? To answer these questions we need to detect anomalous behaviour in a time series. In this article I want to show you how we can do this wit...
[Read more...]

How to change datasources in Tableau

November 27, 2020 | rstats-tips.net

At work I’m using Tableau as a tool for visualizing data with the possibility for the user to filter the data he’s looking at. So the user doesn’t need to program. He can use just is mouse which is great for people who don’t know exactly ...
[Read more...]

Hosting a Shiny App using Docker

October 17, 2020 | rstats-tips.net

I used shinyapps.io for my own shiny app. It’s a great service. You can deploy your app for free, test it and show it to other people. But there’s also a downside: The memory an app can use is limited. So I was looking for another way ... [Read more...]

Hosting a Shiny App at shinyapps.io

October 10, 2020 | rstats-tips.net

As I mentioned earlier I’ve built a shiny app to visualize the development of SARS-CoV-2 in Germany. Running it locally works very well. But how to deploy an app in the web? There is a free service at shinyapps.io where you can host your shiny ap... [Read more...]

Update of SARS-CoV-2 Shiny App

September 18, 2020 | rstats-tips.net

I’ve updated my Shiny-App. Now you can switch between Bundesländer and Landkreise: The lineplot showing the development of Covid-19 infections per day contains one or two additional lines for comparison: The value of the chosen Bundesland and fo...
[Read more...]

Interesting Article about dplyr

September 17, 2020 | rstats-tips.net

dplyr is a wonderful package for data wrangling. It’s far more useful than pandas at the python front. There’s also a constant development to make this package even more useful. If you want to see what you can do with the latest version I s... [Read more...]

Updated Shiny App

September 10, 2020 | rstats-tips.net

Today I’ve updated my Shiny App I wrote about a few days ago. I’m using now Flexdashboard to embed a shiny app into an Rmarkdown-File. Using Flexdashboard caused a little trouble when using observeEvent(). But currently the apps works, but throws a warning regarding observeEvent() in respect to ...
[Read more...]
1 2

Never miss an update!
Subscribe to R-bloggers to receive
e-mails with the latest R posts.
(You will not see this message again.)

Click here to close (This popup will not appear again)