Articles by Richard Layton

A subtle flaw in pull()

July 31, 2024 | Richard Layton

Summary In the current version of dplyr, if x is not a column name in data frame d, then pull(d, x) attempts to look up the value of x in the environment instead of returning NULL or an error. There are ways to augment pull() to yield the exp... [Read more...]

formatdown v0.1.4

May 19, 2024 | Richard Layton

Summary In response to issues raised by users, formatdown has new functionality (and bug fixes) with additional arguments affording greater control over the appearance of the formatted objects. R code library(formatdown) library(data...
[Read more...]

midfieldr v1.0.1

July 8, 2023 | Richard Layton

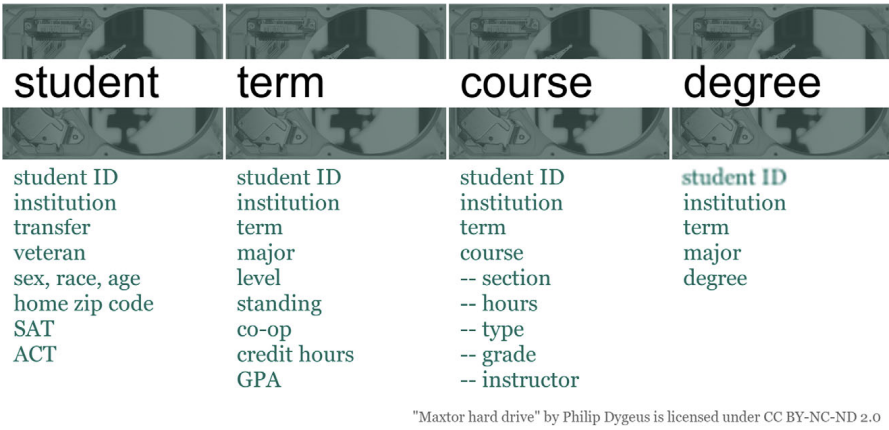
Summary A qualitative overview of the midfieldr package and its application following its initial CRAN release. midfieldr provides tools and recommended methods for working with individual undergraduate student-level records (registrar’s ...
[Read more...]

midfieldr v1.0.1

July 8, 2023 | Richard Layton

Summary A qualitative overview of the midfieldr package and its application following its initial CRAN release. midfieldr provides tools and recommended methods for working with individual undergraduate student-level records (registrar’s...
[Read more...]

Introducing formatdown

November 20, 2022 | Richard Layton

Summary Convert the elements of a numerical vector or data frame column to character strings in which the numbers are formatted using powers-of-ten notation in scientific or engineering form and delimited for rendering as inline equation...
[Read more...]

Multiple studies, one chart

September 4, 2022 | Richard Layton

Summary I redesign a grouped-bar chart to attempt to better align the logic of the display with the logic of the argument. The redesigned chart provides better visual access to year-by-year comparisons by different combinations of catego...
[Read more...]

Spiders, facets, and dots, oh my!

August 20, 2022 | Richard Layton

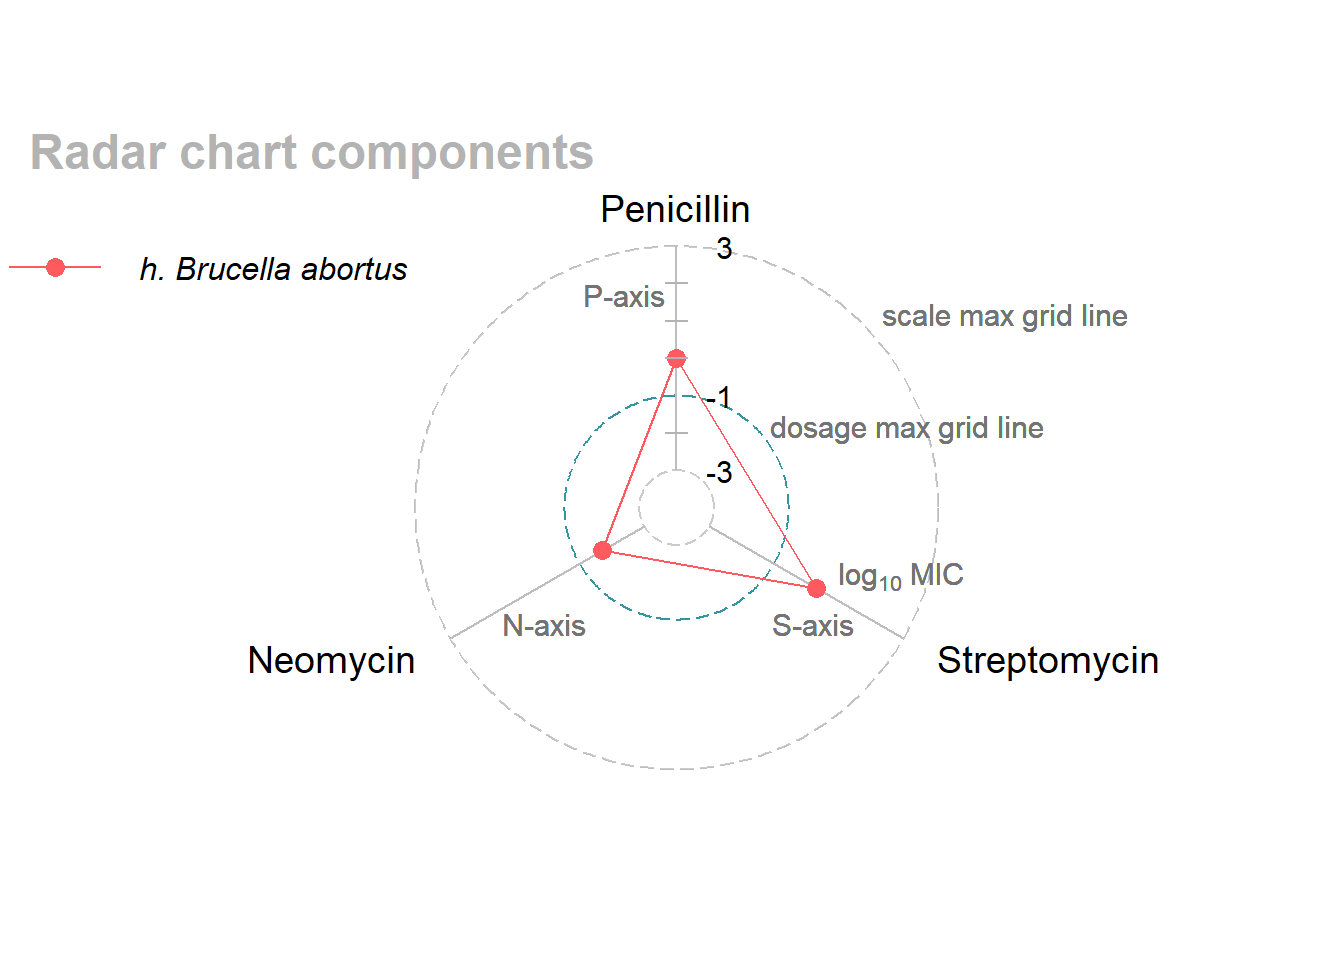
Summary I compare the effectiveness of two charts—a radar (or spider) chart and a faceted dot chart—in communicating information about Burtin’s 1951 antibiotics/bacteria data. The faceted dot chart is more effective, suggesting in genera...
[Read more...]

Never miss an update!
Subscribe to R-bloggers to receive
e-mails with the latest R posts.
(You will not see this message again.)

Click here to close (This popup will not appear again)