Articles by R Views

The SeaClass R Package

October 22, 2017 | R Views

The SeaClass R Package 
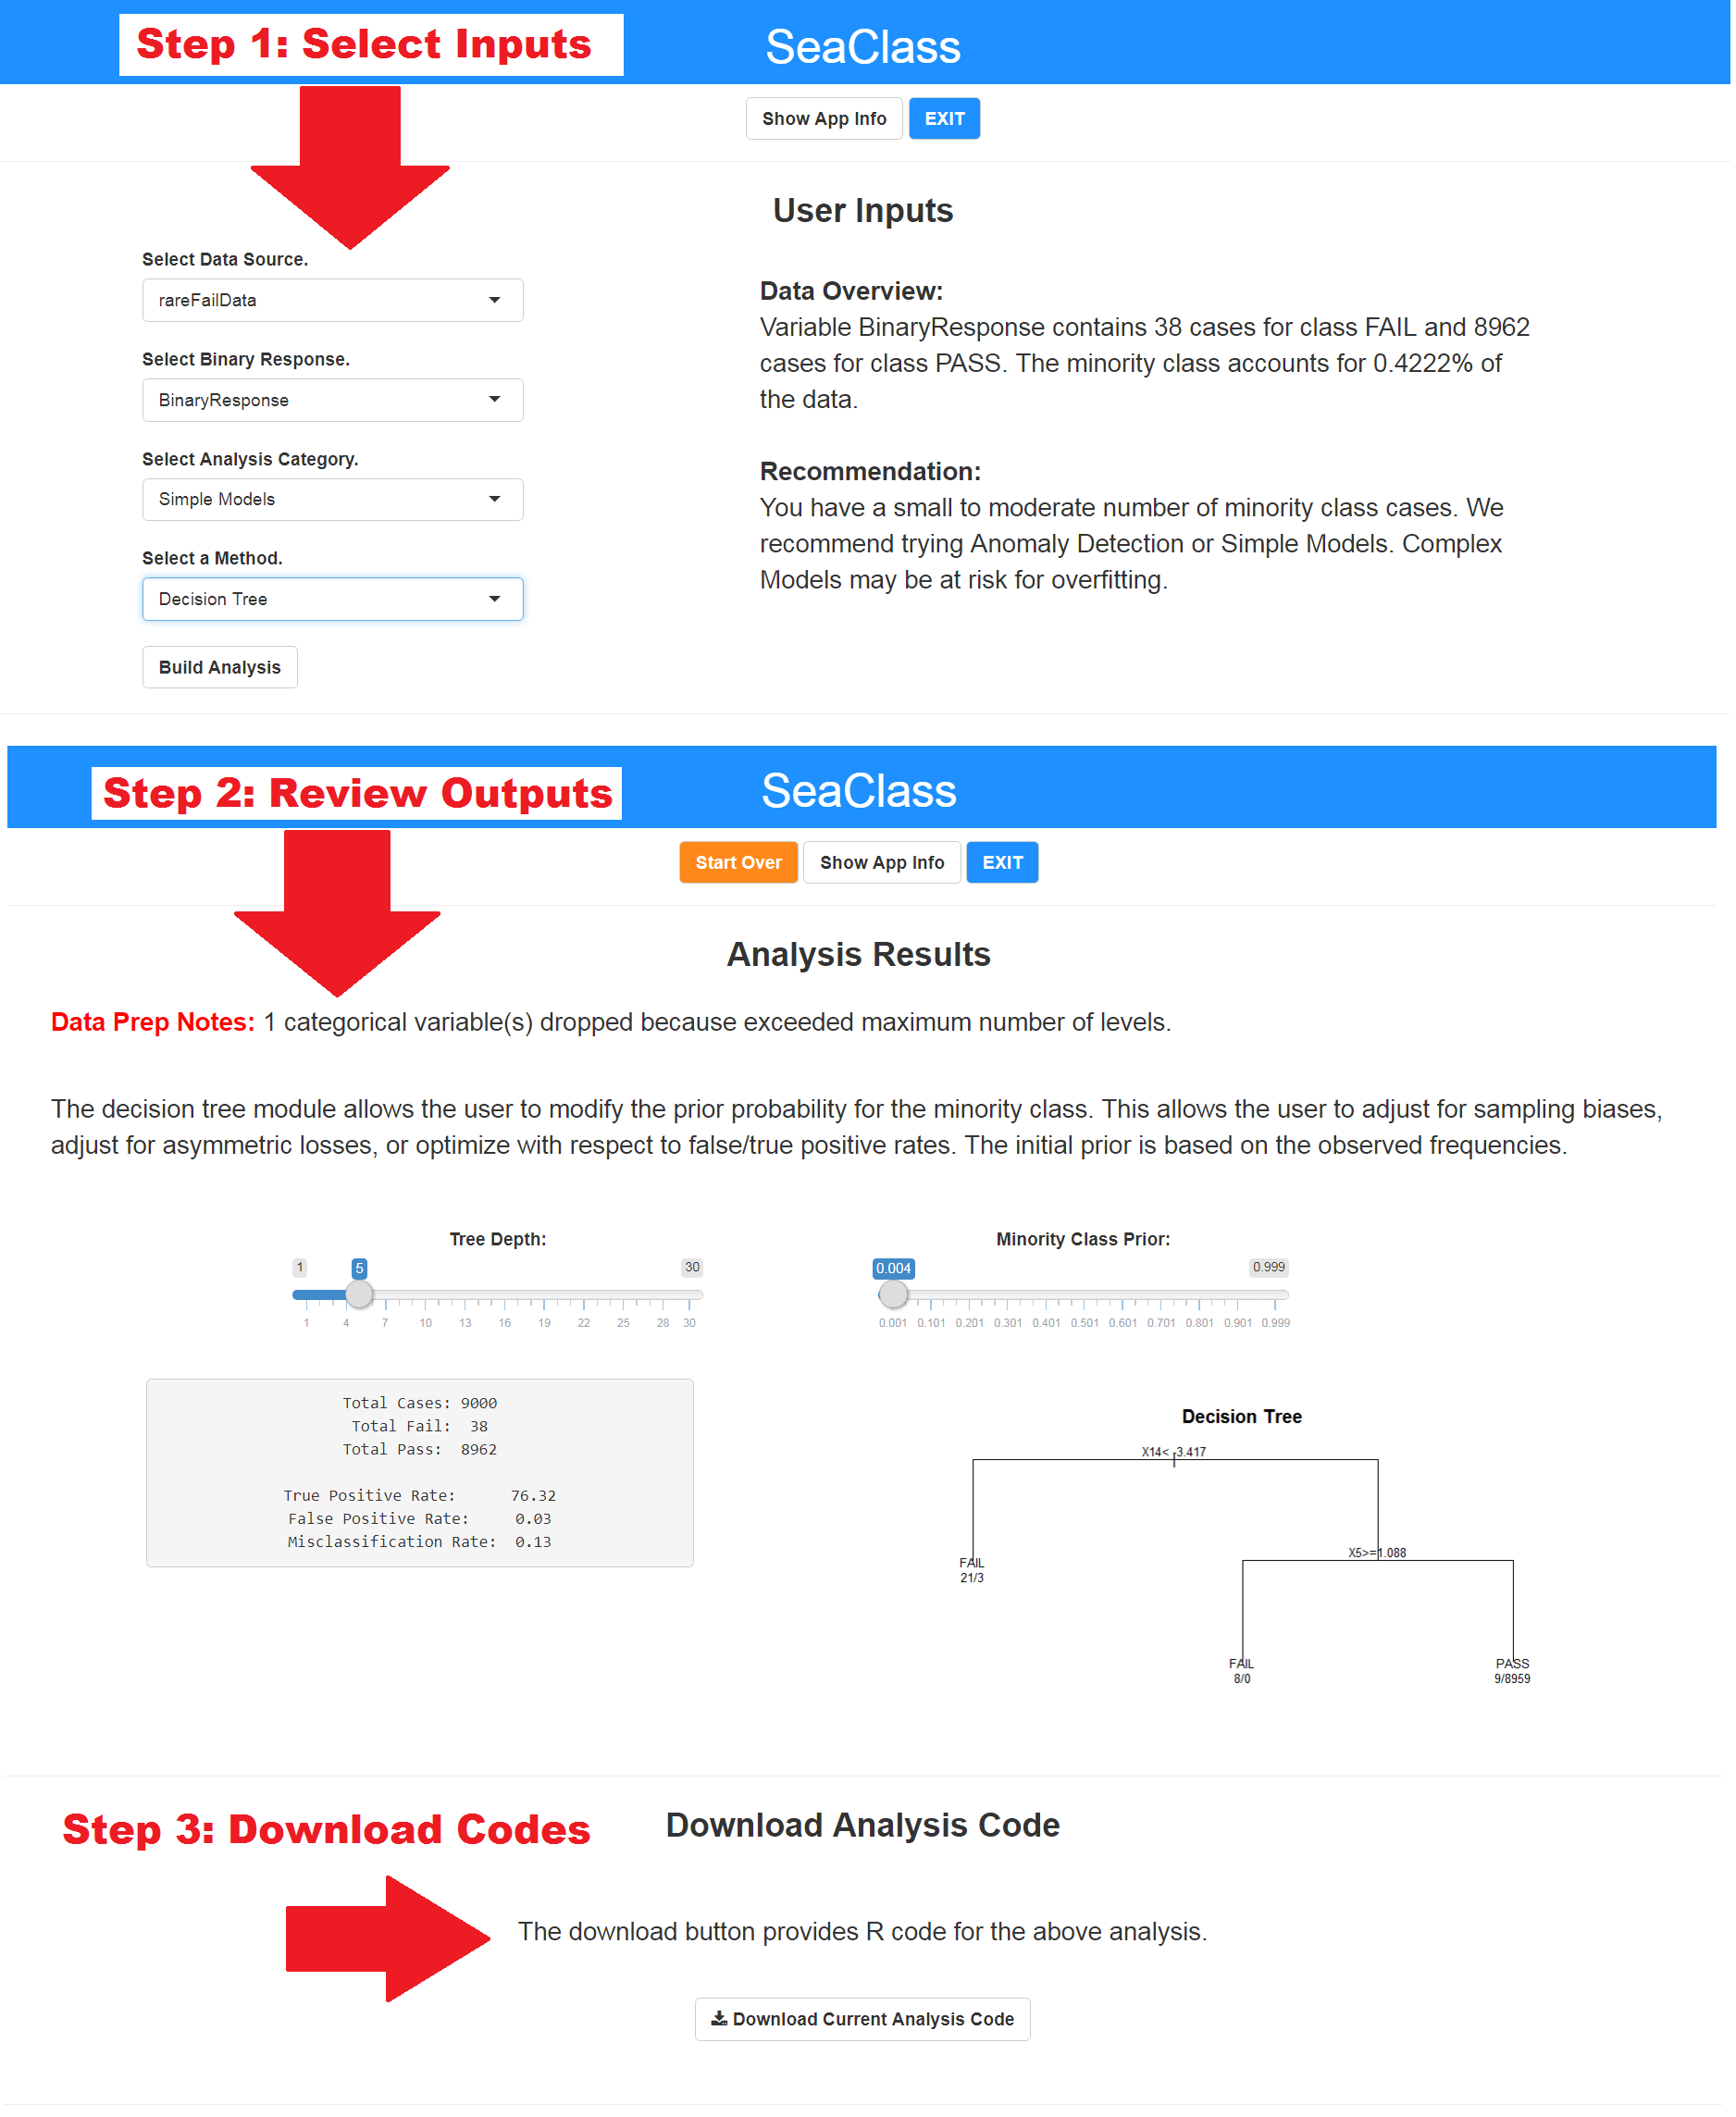
The Operations Technology and Advanced Analytics Group (OTAAG) at Seagate Technology has decided to share an internal project that helps accelerate development of classification models. The interactive SeaClass tool is contained in an R-based package built using shiny and other CRAN packages commonly used for binary ...
[Read more...]

Database Queries With R

October 17, 2017 | R Views

There are many ways to query data with R. This post shows you three of the most common ways: Using DBI Using dplyr syntax Using R Notebooks Background Several recent package improvements make it easier for you to use databases with R. The query examples below demonstrate some of the ...
[Read more...]

Introduction to Portfolio Returns

October 10, 2017 | R Views

Today, we go back a bit to where we probably should have started in the first place, but it wouldn’t have been as much fun. In our previous work on volatility, we zipped through the steps of data import, tidy and transformation. Let’s correct that oversight and do ... [Read more...]

Climate Change and Population Modeling in R

October 8, 2017 | R Views

A recent paper in nature climate change: Less than 2°C warming by 2100 unlikely (Raftery et al. 2017), concludes that the goal of the Paris Agreement is unlikely to be met. Although the conclusion is disheartening, the paper advances the science of climate modeling by developing a joint Bayesian hierarchical model for ...
[Read more...]

August 2017 New Package Picks

September 28, 2017 | R Views

August was a relatively slow month for new R packages; “only” 180 new packages stuck to CRAN. Here are my “Top 40” picks organized into seven categories: Data, Machine Learning, Miscellaneous, Science, Statistics, Utilities and Visualizations. Although they have been written for specialized audiences, I have included the three “Science” packages because, ...
[Read more...]

Survival Analysis with R

September 24, 2017 | R Views

With roots dating back to at least 1662 when John Graunt, a London merchant, published an extensive set of inferences based on mortality records, survival analysis is one of the oldest subfields of Statistics [1]. Basic life-table methods, including techniques for dealing with censored data, were discovered before 1700 [2], and in the early ...
[Read more...]

Report from Mexico City

September 20, 2017 | R Views

Editors Note: It has been heartbreaking watching the images from México City. Teresa Ortiz, co-organizer of R-Ladies CDMX reports on efforts of data scientists to help. Our thoughts are with them, and with the people of México. It has been a hard couple of days around here. In ...
[Read more...]

Enterprise-ready dashboards with Shiny and databases

September 19, 2017 | R Views

Inside the enterprise, a dashboard is expected to have up-to-the-minute information, to have a fast response time despite the large amount of data that supports it, and to be available on any device. An end user may expect that clicking on a bar or column inside a plot will result ...
[Read more...]

Asset Contribution to Portfolio Volatility

September 12, 2017 | R Views

In our previous portfolio volatility work, we covered how to import stock prices, convert to returns and set weights, calculate portfolio volatility, and calculate rolling portfolio volatility. Now we want to break that total portfolio volatility into its constituent parts and investigate how each asset contributes to the volatility. Why ...
[Read more...]

Writing and Publishing my first R package

September 4, 2017 | R Views

Inspired by the Community One of the themes at useR 2017 in Brussels was “Get involved”. People were encouraged to contribute to the community, even when they did not consider themselves R specialists (yet). This could be by writing a package or a blog post, but also by simply correcting typos ... [Read more...]

RStudio::Conf 2018

August 28, 2017 | R Views

It’s not even Labor Day, so it seems to be a bit early to start planning for next year’s R conferences. But, early-bird pricing for RStudio::Conf 2018 ends this Thursday. The conference which will be held in San Diego between January 31st and February 3rd promises to match ...
[Read more...]

July 2017 New Package Picks

August 27, 2017 | R Views

Two hundred and twenty-four new packages were added to CRAN in July. Below are my picks for the “Top 40” packages arranged in eight categories: Machine Learning, Science, Statistics, Numerical Methods, Statistics, Time Series, Utilities and Visualizations. Science and Numerical Methods are categories that I have not used before. The idea ...
[Read more...]

Control Systems Toolbox – System Interconnection

August 23, 2017 | R Views

Introduction Dynamic systems are usually represented by a model before they can be analyzed computationally. These dynamic systems are systems that change, evolve or have their states altered or varied with time based on a set of defined rules. Dynamic systems could be mechanical, electrical, electronic, biological, sociological, and so ...
[Read more...]

Learning things we already know about stocks

August 21, 2017 | R Views

This example groups stocks together in a network that highlights associations within and between the groups using only historical price data. The result is far from ground-breaking; you can already guess the output. For the most part, the stocks get grouped together into pretty obvious business sectors. Despite the obvious ...
[Read more...]

Chapman University DataFest Highlights

August 17, 2017 | R Views

Editor’s Note: The 2017 Chapman University DataFest was held during the weekend of April 21-23. The 2018 DataFest will be held during the weekend of April 27-29. DataFest was founded by Rob Gould in 2011 at UCLA with 40 students. In just seven years, it has grown to 31 sites in three countries. Have ...
[Read more...]

Visualizations with R and Databases

August 15, 2017 | R Views

The Challenge Visualizations are one of R’s strengths. There are many functions and packages that create complex plots, often with one simple command. These plotting functions do two things: first, they take the raw data and run the calculations needed for a given visualization, and second, they draw the ...
[Read more...]

End-to-end visualization using ggplot2

August 13, 2017 | R Views

ggplot2 is kind of a household word for R users. I’ve ended up using it for complex data munging and wrangling work, where I needed to get clarity on different aspects of the data, especially being able to get different views, slices and dices of it, but in a ...
[Read more...]

Portfolio Volatility Shiny App

August 8, 2017 | R Views

In our 3 previous posts, we walked through how to calculate portfolio volatility, then how to calculate rolling volatility, and then how to visualize rolling volatility. Today, we will wrap all of that work into a Shiny app that allows a user to construct his or her own five-asset portfolio, choose ... [Read more...]

R and Interactive Graphics

August 6, 2017 | R Views

Judging from the number of JSM talks that incorporated interactive visualizations of some sort or another, it appears that interactive graphics have captured the attention of a good many statisticians. I found this a little surprising. Statisticians, on the whole, are not easily impressed by “eye candy”, and I believe ...
[Read more...]
1 13 14 15 16 17 18

Never miss an update!
Subscribe to R-bloggers to receive
e-mails with the latest R posts.
(You will not see this message again.)

Click here to close (This popup will not appear again)