Creating template files with R
Over the past few months, I’ve found myself fine-tuning the structure of my R scripts for
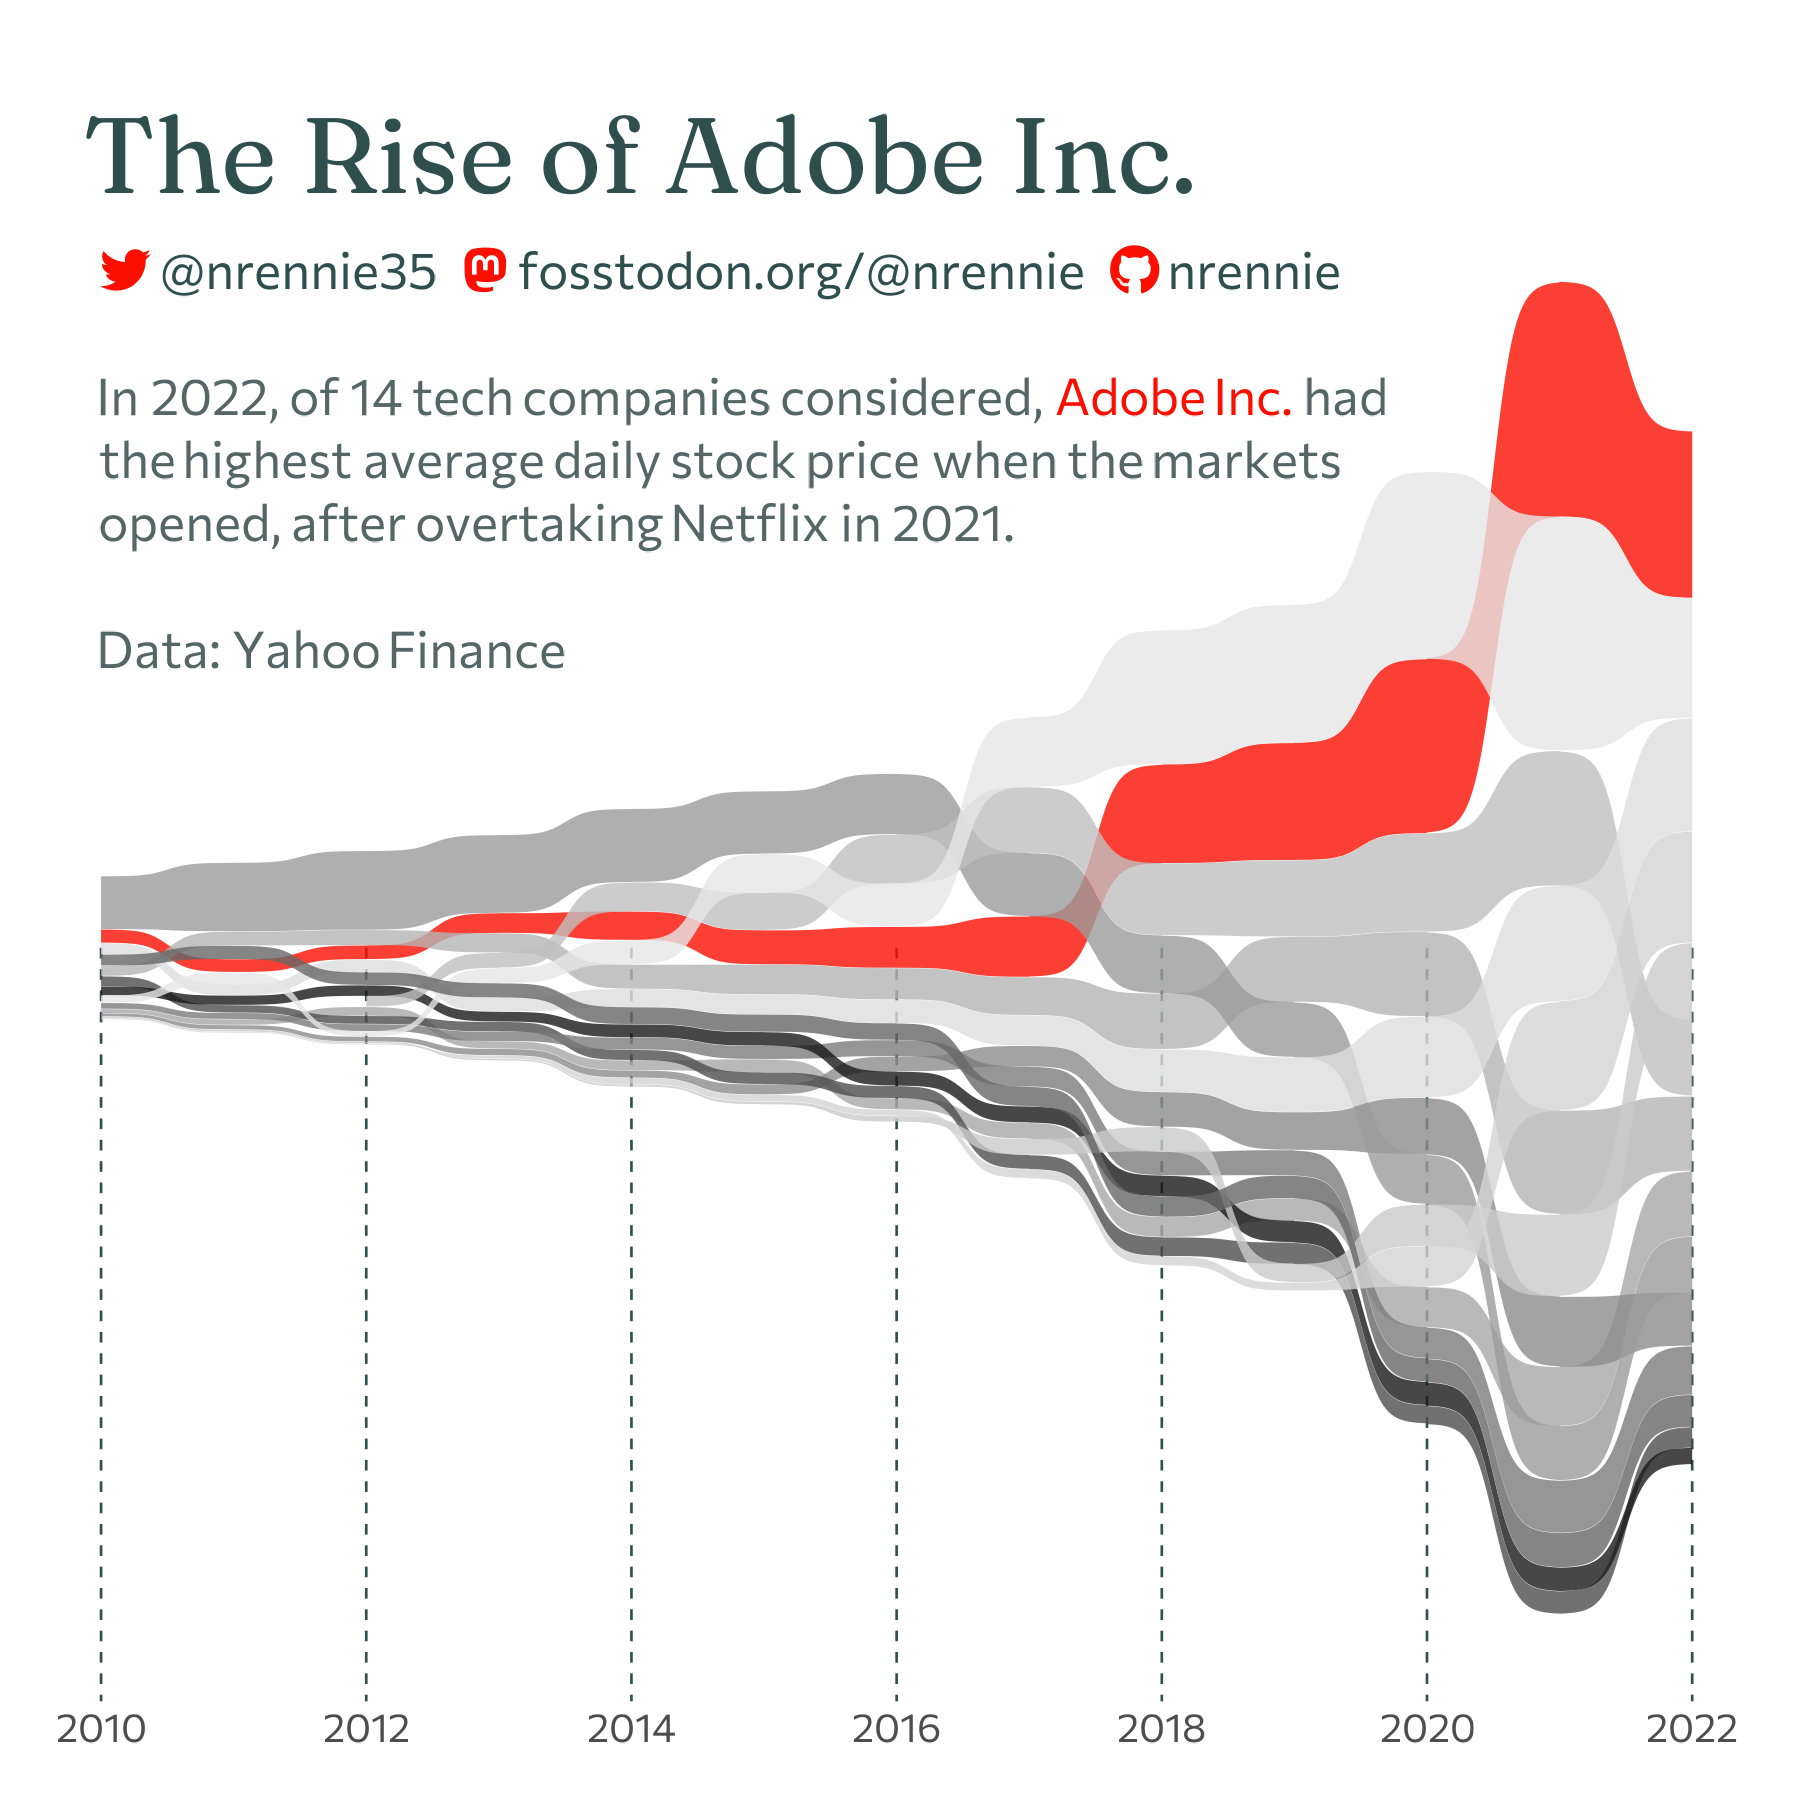
#TidyTuesday, and each week they have similar sections: load packages, load data, data wrangling, make a plot, save the plot, and so on. What I’ve en...