Articles by R on Guangchuang Yu

scatterpie for plotting pies on ggplot

December 6, 2016 | R on Guangchuang Yu

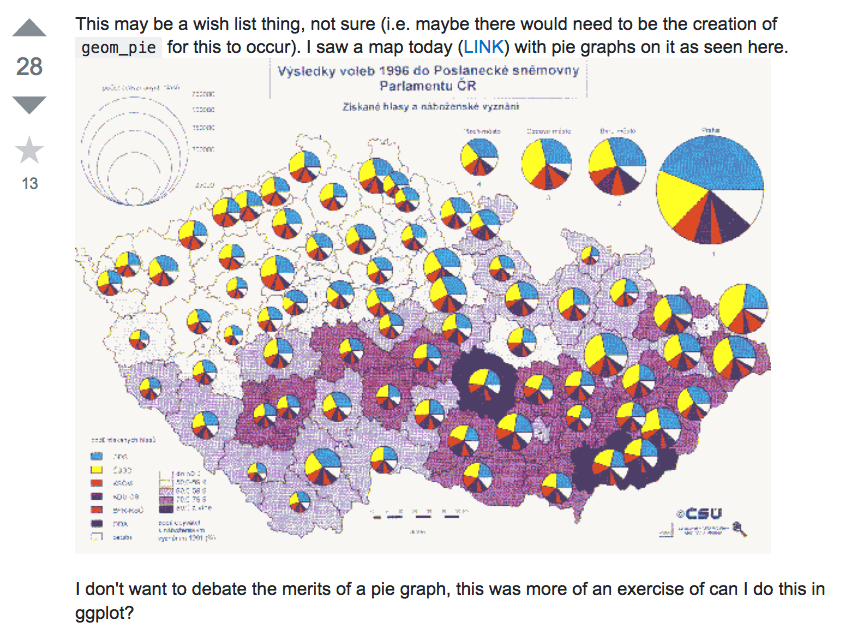
Plotting pies on ggplot/ggmap is not an easy task, as ggplot2 doesn’t provide native pie geom. The pie we produced in ggplot2 is actually a barplot transform to polar coordination. This make it difficult if we want to produce a map like the above screenshot, which was posted ...
[Read more...]

showCategory parameter for visualizing compareCluster output

November 2, 2016 | R on Guangchuang Yu

I am using dotplot() to visualize results from enrichGO(), enrichDO(), enricher() and compareCluster() in clusterProfiler R package. When specifying showCategory, I get the right number of categories except with the results of compareCluser(). In my case, I use compareCluster() on a list of 3 elements:
str(ClusterList)
List of 3
 $ All : chr [1:1450] "89886" "29923" "100132891" "101410536" ...
 $ g1  : chr [1:858] "89886" "29923" "100132891" "101410536" ...
 $ g2: chr [1:592] "5325" "170691" "29953" "283392" ...
CompareGO_BP=compareCluster(ClusterList, fun="enrichGO", pvalueCutoff=0.01, pAdjustMethod="BH", OrgDb=org.Hs.eg.db,ont="BP",readable=T)

dotplot(CompareGO_BP, showCategory=10, title="GO - Biological Process")
I ask for 10 categories, but ...
[Read more...]

[Bioc 34] NEWS of my BioC packages

October 19, 2016 | R on Guangchuang Yu

I have 7 packages published within the Bioconductor project. ChIPseeker clusterProfiler DOSE ggtree GOSemSim meshes ReactomePA A new package meshes was included in BioC 3.4 release. ChIPseeker For ChIPseeker, this release fixed several minor bugs. GEO data was updated, now ChIPseeker contains 20947 bed file information.
CHANGES IN VERSION 1.9.8
------------------------
 o plotAvgProf/plotAvgProf2 order of panel by names of input tagMatrix List <2016-09-25, Sun>
 o test ENSEMBL ID using '^ENS' instead of '^ENSG' <2016-09-20, Tue>
   + https://github.com/GuangchuangYu/ChIPseeker/issues/41

CHANGES IN VERSION 1.9.7
------------------------
 o unit test <2016-08-16, Tue>

CHANGES IN VERSION 1.9.6
------------------------
 o update vignette <2016-08-16, Tue>

CHANGES IN VERSION 1.9.5
------------------------
 o when TxDb doesn't have gene_id information, converting gene ID (ensembl/entrez and symbol) will be omitted instead of throw error. <2016-08-02, Tue>
   + https://www.biostars.org/p/204142
 o bug fixed if testing targetPeak is a list of GRanges objects in enrichPeakOverlap function <2016-07-20, Wed>
   + https://github.com/GuangchuangYu/ChIPseeker/issues/37
   + https://github.com/GuangchuangYu/ChIPseeker/issues/36
 o fixed typo in determine gene ID type <2016-06-21, Tue>
   + https://github.com/GuangchuangYu/ChIPseeker/issues/28#issuecomment-227212519
 o move upsetplot generics to DOSE and import from DOSE to prevent function name conflict <2016-06-14, Tue>

CHANGES IN VERSION 1.9.4
------------------------
 o bug fixed <2016-06-08, Wed>
   + https://github.com/GuangchuangYu/ChIPseeker/issues/17#issuecomment-224407402
   + https://github.com/GuangchuangYu/ChIPseeker/pull/24/files

CHANGES IN VERSION 1.9.3
------------------------
 o use byte compiler <2016-05-18, Wed>
 o https://github.com/Bioconductor-mirror/ChIPseeker/commit/f1ada57b9c66a1a44355bbbbdaf5b0a88e10cf7d

CHANGES IN VERSION 1.9.2
------------------------
 o name tagMatrix in plotAvgProf automatically if missing <2016-05-12, Thu>
 o https://github.com/Bioconductor-mirror/ChIPseeker/commit/d5f16b2bc01725e30282c3acb33007ef521a514c

CHANGES IN VERSION 1.9.1
------------------------
 o bug fixed in getNearestFeatureIndicesAndDistances <2016-05-11, Wed>
   + correct metadata in dummy NA feature
clusterProfiler Thanks to the update of ... [Read more...]

reproducible logo generated by ggtree

October 14, 2016 | R on Guangchuang Yu

ggtree provides many helper functions for manupulating phylogenetic trees and make it easy to explore tree structure visually. Here, as examples, I used ggtree to draw capital character G and C, which are first letter of my name :-). To draw a tree in such shape, we need fan layout (...
[Read more...]

ggtree for outbreak data

September 19, 2016 | R on Guangchuang Yu

OutbreakTools implements basic tools for the analysis of Disease Outbreaks. It defines S4 class obkData to store case-base outbreak data. It also provides a function, plotggphy, to visualize such data on the phylogenetic tree.
library(OutbreakTools)
data(FluH1N1pdm2009)
attach(FluH1N1pdm2009)


x <- new("obkData", individuals = individuals, dna = FluH1N1pdm2009$dna,
         dna.individualID = samples$individualID, dna.date = samples$date,
         trees = FluH1N1pdm2009$trees)

plotggphy(x, ladderize = TRUE, branch.unit = "year",
          tip.color = "location", tip.size = 3, tip.alpha = 0.75)
As I mentioned in the post, ggtree for microbiome data, ggtree fits the R ecosystem ...
[Read more...]

ggtree for microbiome data

August 31, 2016 | R on Guangchuang Yu

ggtree can parse many software outputs and the evolution evidences inferred by these software can be used directly for tree annotation. ggtree not only works as an infrastructure that enables evolutionary data that inferred by commonly used software packages to be used in R, but also serves as a general ...
[Read more...]

ggtree paper published

August 16, 2016 | R on Guangchuang Yu

Today ggtree received 100 stars on and I found the paper was online at the same day by the tweet: ggtree, Methods in Ecology and Evolutionに掲載されたのか。オープンアクセスっぽいな。https://t.co/JlET18BSZv— ホクソピペット (@siero5335) August 16, 2016 I am quite exciting about it. Now ggtree is citable by doi:10.1111/2041-210X.12628. In the review period, ...
[Read more...]

using meshes for MeSH Enrichment Analysis

August 2, 2016 | R on Guangchuang Yu

MeSH (Medical Subject Headings) is the NLM (U.S. National Library of Medicine) controlled vocabulary used to manually index articles for MEDLINE/PubMed. MeSH is comprehensive life science vocabulary. MeSH has 19 categories and MeSH.db contains 16 of them. That is: Abbreviation Category A Anatomy B Organisms C Diseases D Chemicals ...
[Read more...]

using clusterProfiler for MeSH Enrichment Analysis

August 2, 2016 | R on Guangchuang Yu

MeSH (Medical Subject Headings) is the NLM (U.S. National Library of Medicine) controlled vocabulary used to manually index articles for MEDLINE/PubMed. MeSH is comprehensive life science vocabulary. MeSH has 19 categories and MeSH.db contains 16 of them. That is: Abbreviation Category A Anatomy B Organisms C Diseases D Chemicals ...
[Read more...]

leading edge analysis

July 20, 2016 | R on Guangchuang Yu

leading edge and core enrichment Leading edge analysis reports Tags to indicate the percentage of genes contributing to the enrichment score, List to indicate where in the list the enrichment score is attained and Signal for enrichment signal strength. It would also be very interesting to get the core enriched ...
[Read more...]

How to bug author

July 5, 2016 | R on Guangchuang Yu

As an author of several Bioconductor packages. I found many questions from users are quite annoying. Some of them never use google and they are reluctant to read vignettes. Step 1: make sure you are using the latest release I found many peoples are using out-of-date packages. When they got an ... [Read more...]

identify method for ggtree

June 28, 2016 | R on Guangchuang Yu

We are happy to announce that ggtree supports interactive tree annotation/manipulation by implementing an identify method. Users can click on a node to highlight a clade, to label or rotate it etc. Here is an example of highlighting clades using geom_hilight with identify: Here is another example of ... [Read more...]

Running multiple correlations with R and T-SQL

June 26, 2016 | R on Guangchuang Yu

Getting to know the data is always an interesting part of data science. With R integration into SQL Server, the exploration part is still part of the game. Usual way to get some statistics out of the dataset is to run some frequencies, descriptive statistics and nevertheless correlations. Running correlations ...
[Read more...]
1 2 3 4 8

Never miss an update!
Subscribe to R-bloggers to receive
e-mails with the latest R posts.
(You will not see this message again.)

Click here to close (This popup will not appear again)