Articles by R on datistics

parcats 0.0.3 released

October 17, 2021 | R on datistics

parcats 0.0.3 was released on CRAN. It is an htmlwidget providing bindings to the plotly.js parcats trace, which is not supported by the plotly R package. It also adds marginal histograms for numerical variables. demogif github documentation Better {shiny} Support It now integrates better into shiny apps. There is a ... [Read more...]

simaerep

November 9, 2020 | R on datistics

Adverse Events An adverse event (AE) is any untoward medical occurrence in a patient or participating in a clincial trial. These events are not necessarily drug related. It could anything from a headache to a sporting acci...
[Read more...]

easyalluvial 0.2.3 released

May 16, 2020 | R on datistics

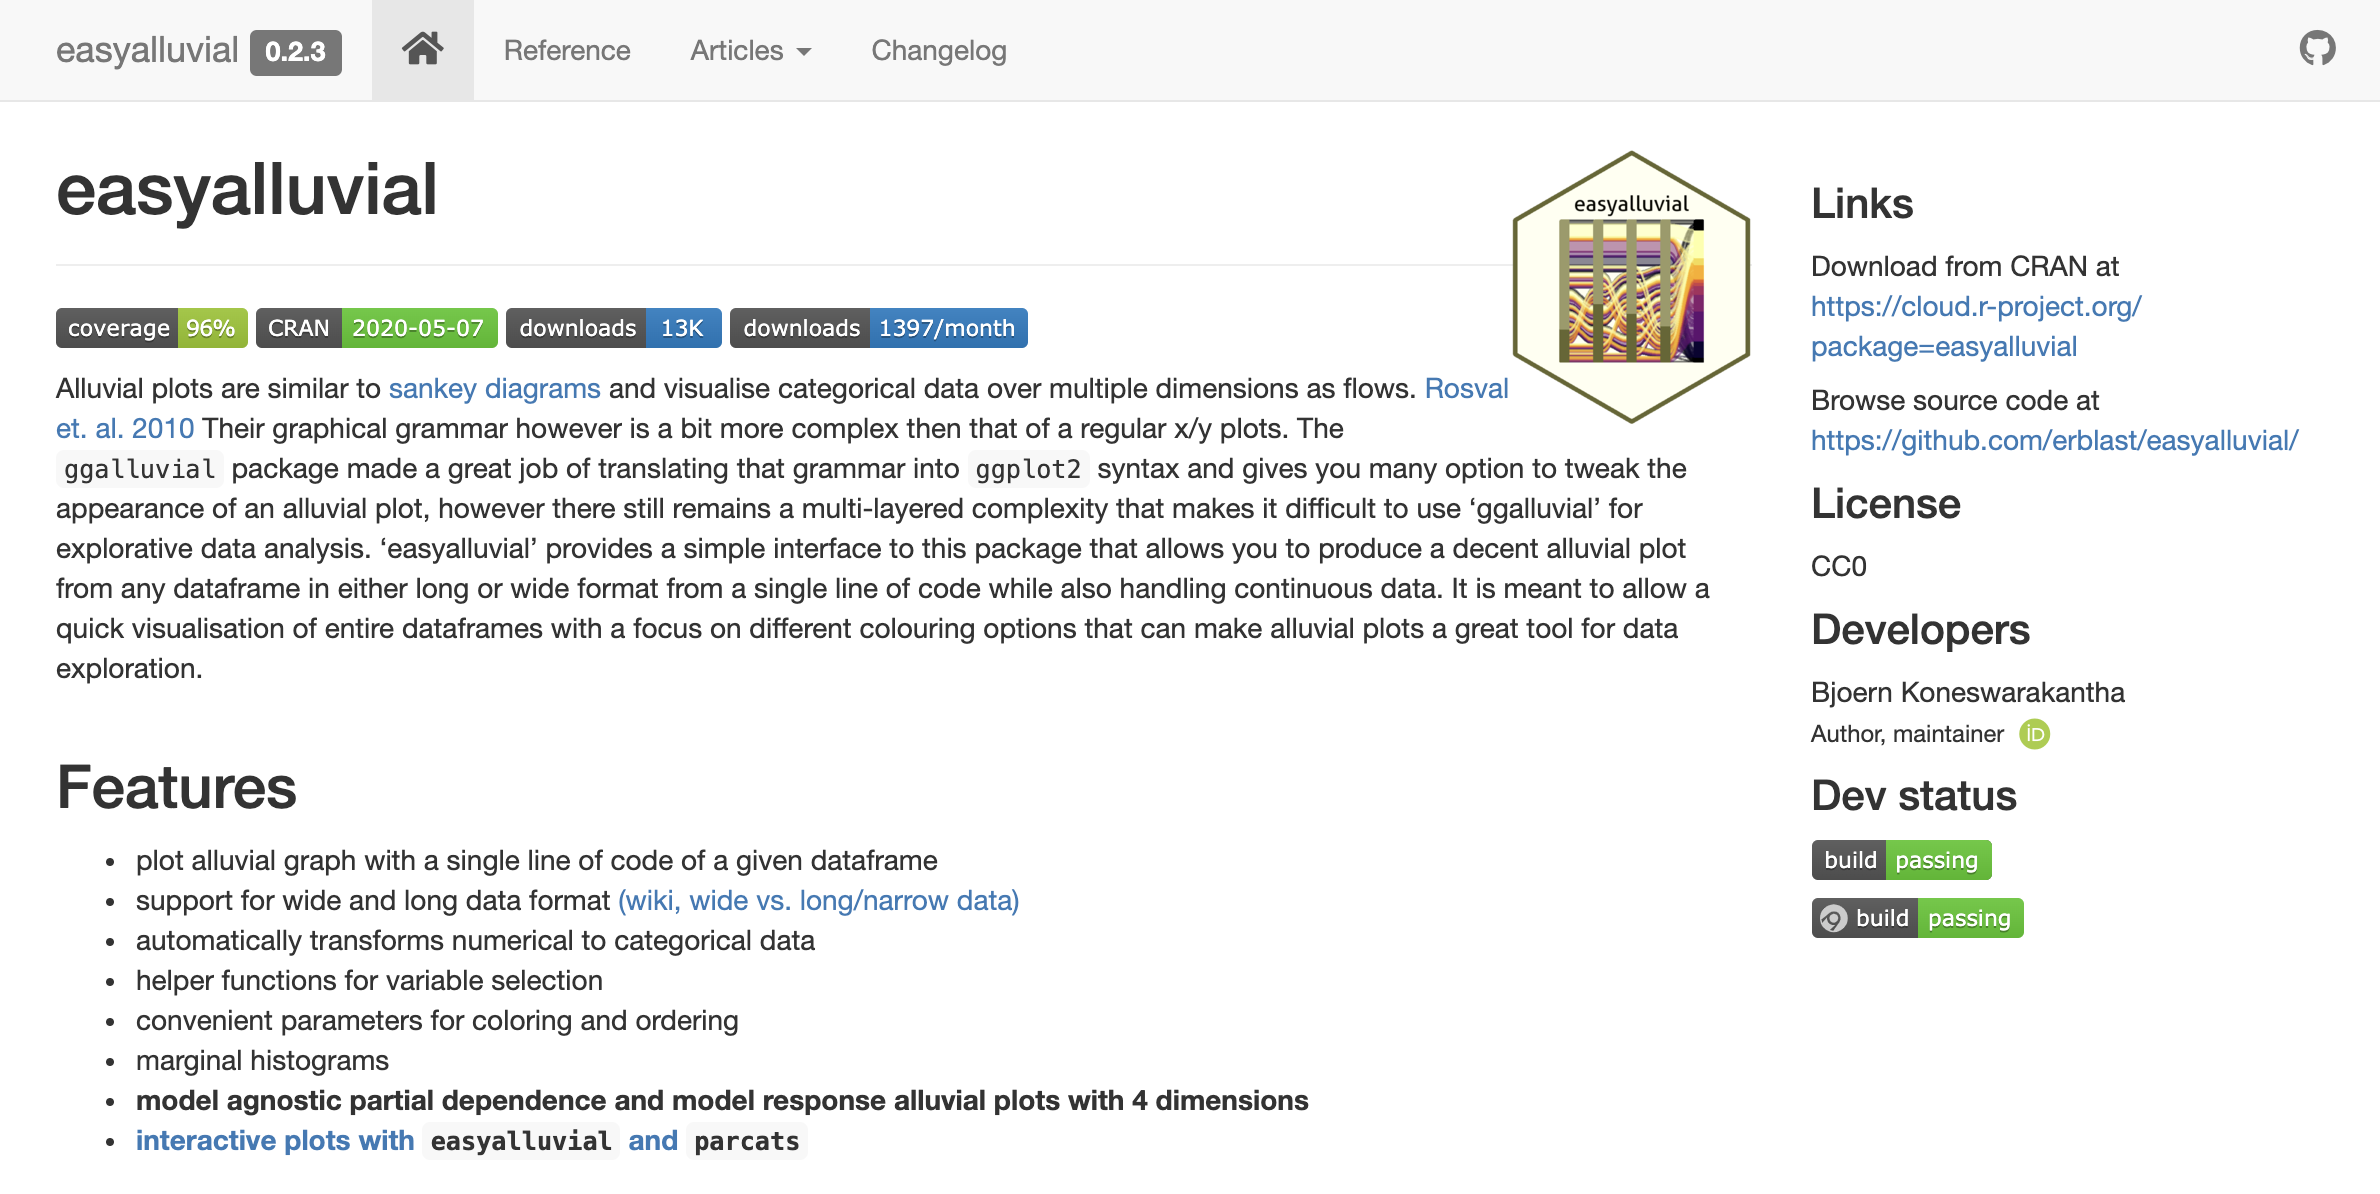
easyalluvial allows you to build exploratory and interactive alluvial plots (sankey diagrams) with a single line of code while automatically binning numerical variables. This release 0.2.3 ensures dplyr 1.0.0 compatibilitiy and now builds a slick pkgdown documentation website and makes better use of Travis CI using multiple builds to test compatibility with ...
[Read more...]

parcats 0.0.1 released

December 4, 2019 | R on datistics

parcats was released on CRAN. It is an htmlwidget providing bindings to the plotly.js parcats trace, which is not supported by the plotly R package. Also adds marginal histograms for numerical variables. demogif github documentation What it can do I wanted to add interactivity to easyalluvial plots for a ... [Read more...]

Easyalluvial 0.2.1 released

September 16, 2019 | R on datistics

easyalluvial allows you to build exploratory alluvial plots (sankey diagrams) with a single line of code while automatically binning numerical variables. This releas 0.2.1 ensures tidyr 1.0.0 compatibility and fixes a bug around categorical variables for model response plots Model Response Plots with Categorical Variables This feature had som glitches before as ...
[Read more...]

Visualising Model Response with easyalluvial

April 9, 2019 | R on datistics

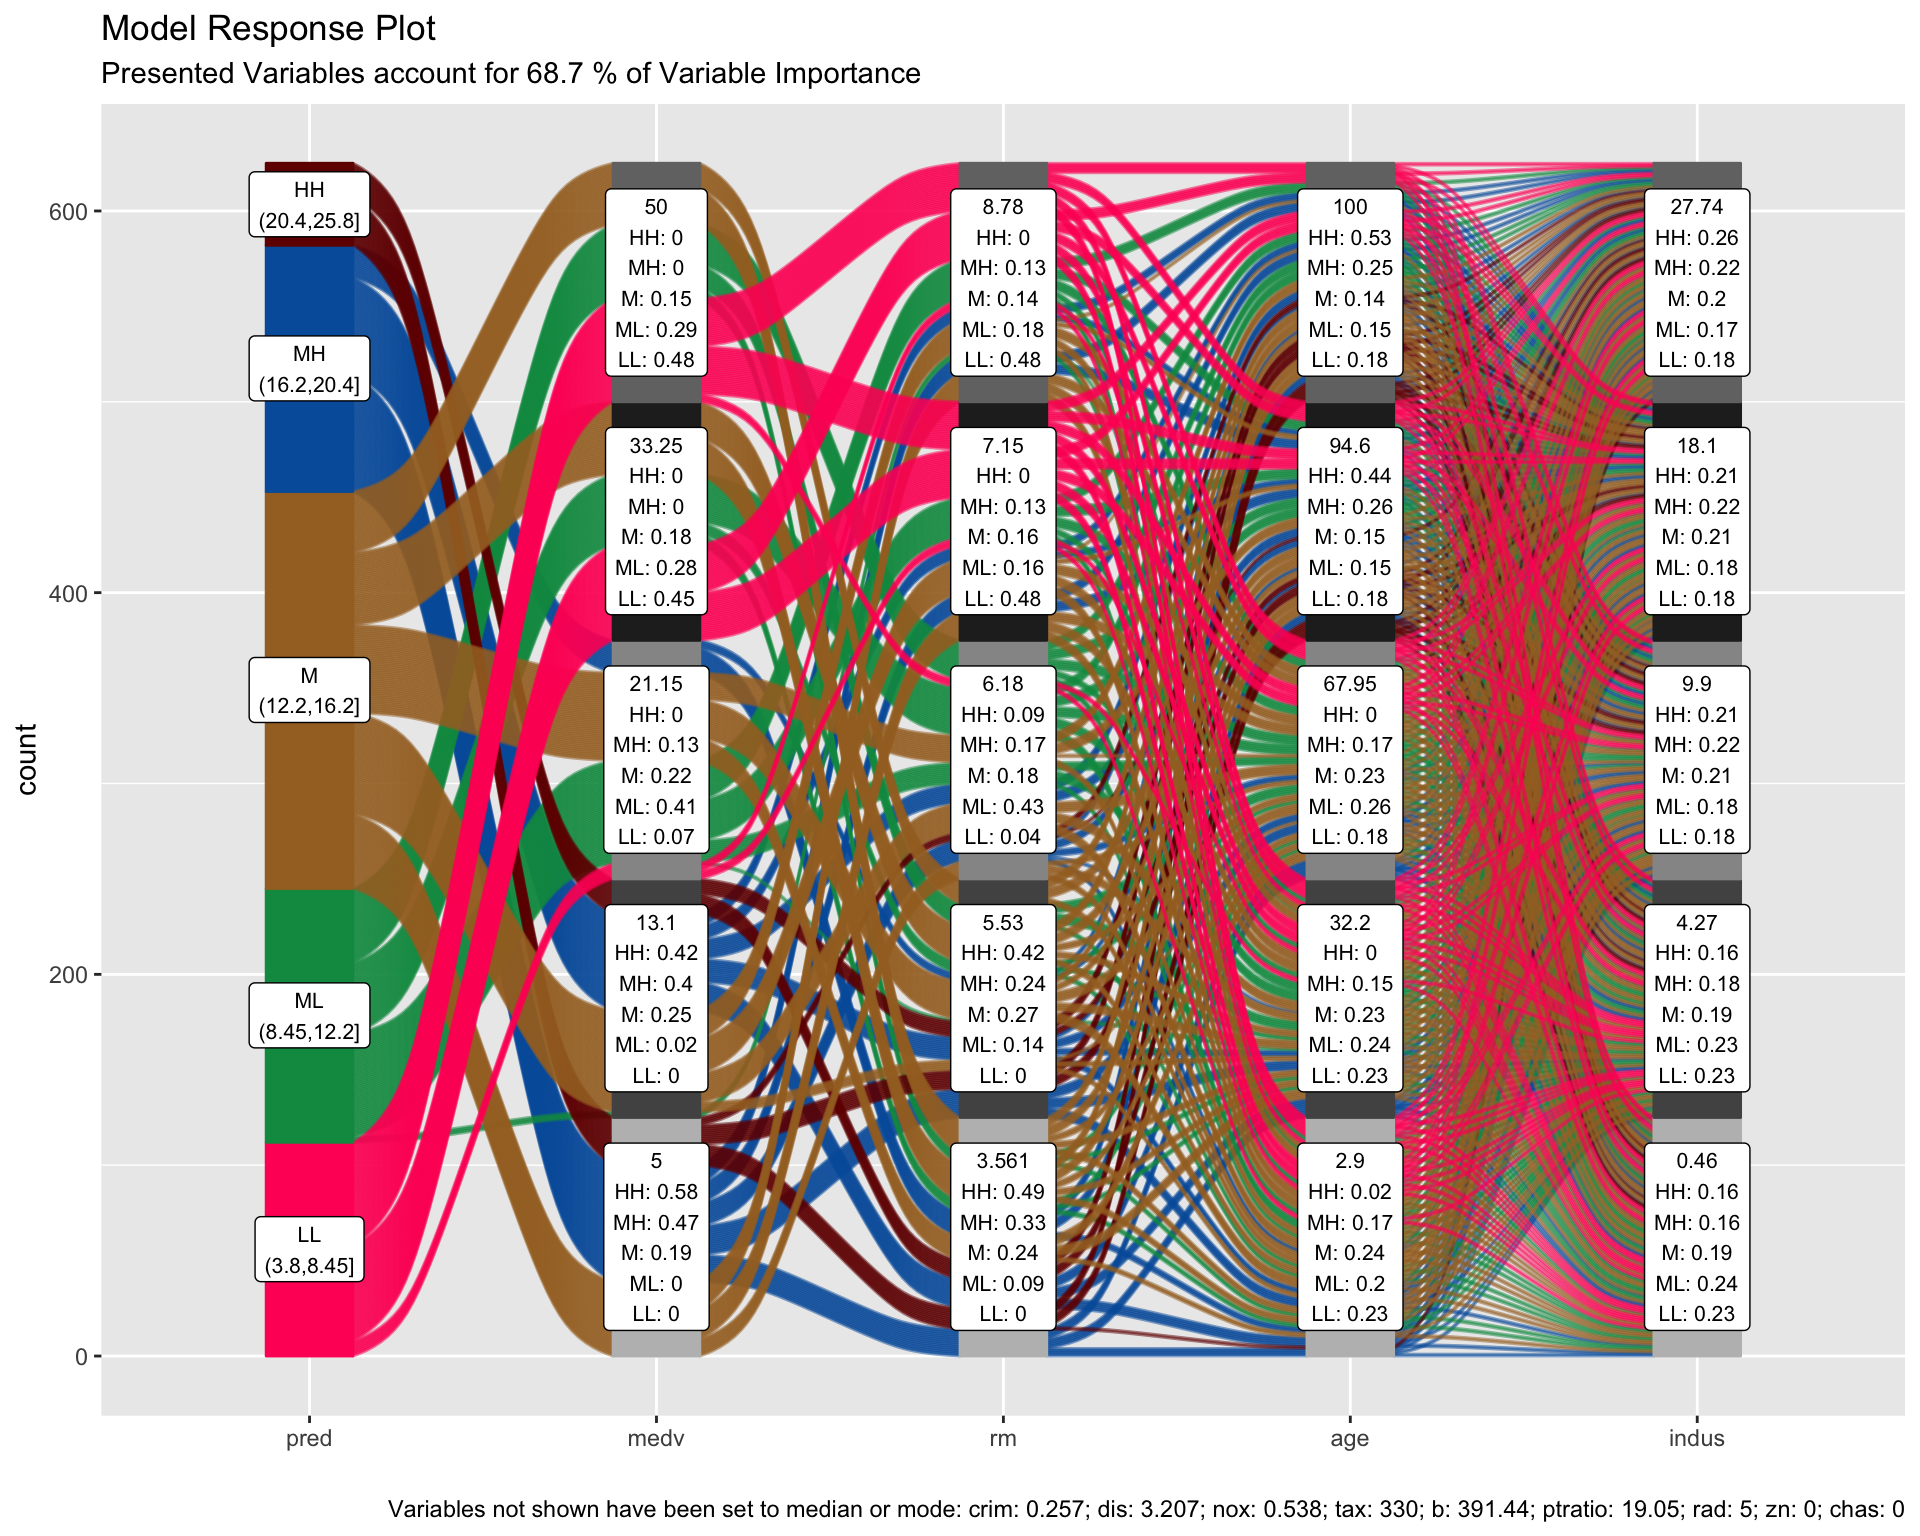
In this tutorial I want to show how you can use alluvial plots to visualise model response in up to 4 dimensions. easyalluvial generates an artificial data space using fixed values for unplotted variables or uses the partial dependence plotting method. It is model agnostic but offers some convenient wrappers for ...
[Read more...]

Easyalluvial 0.2.0 released

March 31, 2019 | R on datistics

easyalluvial allows you to build exploratory alluvial plots (sankey diagrams) with a single line of code while automatically binning numerical variables. In version 0.2.0 marginal histograms improve the visibility of those numerical variables. Further a method has been added that creates model agnostic 4 dimensional partial dependence alluvial plots to visualise the ...
[Read more...]

Visualising Model Response with easyalluvial

March 28, 2019 | R on datistics

In this tutorial I want to show how you can use alluvial plots to visualise model response in up to 4 dimensions. easyalluvial generates artificial data space using fixed values for unplotted variables or uses the partial dependence plotting method. It is model agnostic but offers some convenient wrappers for caret ...
[Read more...]

Tidymodels

December 28, 2018 | R on datistics

Introduction Packages CRAN availability of tidymodels packages: Unified Modelling Syntax Statistical Tests and Model Selection Resampling, Feature Engineering and Performance Metrics Modeling Data Response Variable lstat Correlations lstat vs categorical variables Preprocessing with recipe Summary Recipe Resampling with rsample Modelling with caret Wrapper Apply Wrapper Assess Performance with yardstick Parameters ...
[Read more...]

Joyplot Logo

August 2, 2018 | R on datistics

Welcome to my data science blog datistics where I will gradually post all the vignettes and programming POC’s that I have written over the past two years. Most of them can be already found in my github repository. I am using blogdown to create this blog and using R ...
[Read more...]

Never miss an update!
Subscribe to R-bloggers to receive
e-mails with the latest R posts.
(You will not see this message again.)

Click here to close (This popup will not appear again)