NYC buses: C5.0 classification with R; more than 20 minute delay?
CategoriesAdvanced Modeling
Tags
Data Management
Data Visualisation
R Programming
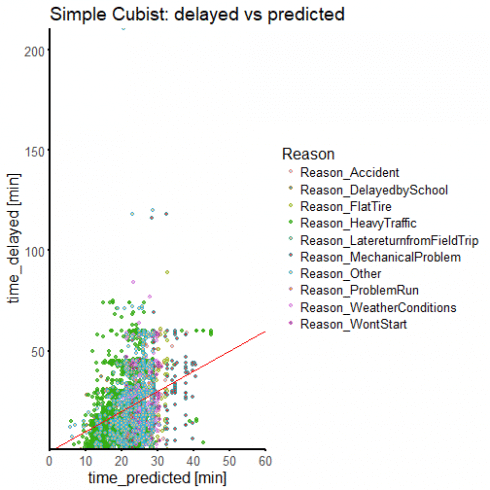
We are continuing on with our NYC bus breakdown problem. When we left off, we had constructed a rule-based Cubist regression model with our expanded pool of predictors; but we were still only managing to explain 37% of the data's variance with ...