Articles by morphoscape

Comparing Data Sets with Venn Diagrams

August 22, 2020 | morphoscape

Venn diagrams are a great way to visualize informative comparisons between data sets. It can be particularly helpful to use venn diagrams to look at how similar data is across multiple data sets, or within the same data set. The types of comparisons you can make will depend on how ...
[Read more...]

Uniquely Merge Fasta Files – Tidy Plots

May 23, 2020 | morphoscape

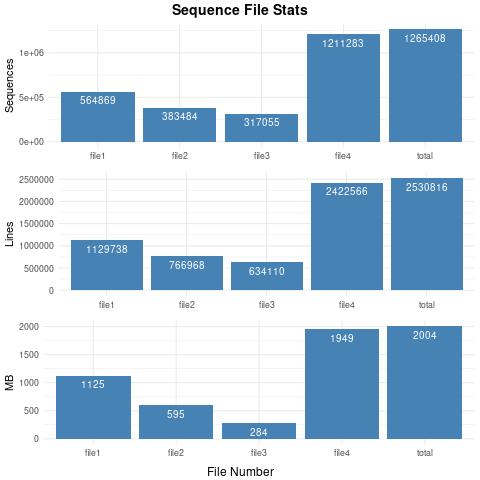
One of the best ways to compare the characteristics of any data set is to create descriptive plots. The following R scripts have been improved to generate plots of sequence, line, and size statistics for a set of input fasta files. The example outputs have been generated from these scripts ...
[Read more...]

Intron Characteristics from GFF

April 25, 2020 | morphoscape

To calculate min, median, mean, and max intron lengths from a gff file use the intronsByTranscript function of GenomicFeatures in R. Be sure to first use the makeTxDbFromGFF function of GenomicFeatures to create a TxDb object of th...
[Read more...]

Never miss an update!
Subscribe to R-bloggers to receive
e-mails with the latest R posts.
(You will not see this message again.)

Click here to close (This popup will not appear again)