Articles by kjytay

Downloading datasets from Our World in Data in R

January 30, 2025 | kjytay

I recently learned from Allen Downey’s blog that Our World in Data is providing API access to their data. Our World in Data hosts datasets across several important topics, from population and demographic change, poverty and economic development, to human … Continue reading →
[Read more...]

A quirk when using data.table?

June 3, 2022 | kjytay

I recently came across this quirk in using data.table that I don’t really have a clean solution for. I outline the issue below as well as my current way around it. Appreciate any better solutions! The problem surfaces quite generally, … Continue reading →
[Read more...]

A short note on the startsWith function

May 4, 2022 | kjytay

The startsWith function comes with base R, and determines whether entries of an input start with a given prefix. (The endsWith function does the same thing but for suffixes.) The following code checks if each of “ant”, “banana” and “balloon” … Continue reading → [Read more...]

What is a horizon chart?

March 30, 2022 | kjytay

A horizon chart is a compact version of an area chart. In the words of Jonathan Schwabish (Reference 1, page 164), it is … an area chart that is sliced into equal horizontal intervals and collapsed down into single bands, … Continue reading →
[Read more...]

Comparing the Bradley Terry model to betting odds

February 5, 2022 | kjytay

In this previous post, I described the Bradley-Terry model and showed how we could use it to predict game outcomes in the NBA 2018-19 regular season. After ffitting the Bradley-Terry model on the first half of the regular season (with … Continue reading →
[Read more...]

What is the Bradley-Terry model?

February 1, 2022 | kjytay

The Bradley-Terry model The Bradley-Terry model, named after R. A. Bradley and M. E. Terry, is a probability model for predicting the outcome of a paired comparison. Imagine that we have teams competing against each other. The model assigns team … Continue reading →
[Read more...]

Playing Wordle in R

January 18, 2022 | kjytay

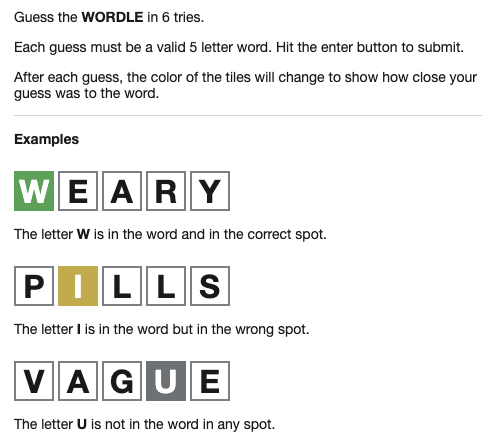
The game Wordle has taken the world (or at least my facebook feed) by storm. It’s a really simple word game that’s a lot like the classic Mastermind. Here are the rules from the Wordle website: The logic behind the … Continue reading →
[Read more...]

Simulating dice bingo

December 30, 2021 | kjytay

Note: This post was inspired by the “Classroom Bingo” probability puzzle in the Royal Statistical Society’s Significance magazine (Dec 2021 edition). Set-up Imagine that we are playing bingo, but where the numbers are generated by the roll of two 6-sided … Continue reading →
[Read more...]

Verifying a stat from The Athletic NBA Show

December 18, 2021 | kjytay

A few weeks ago, I was listening to The Athletic NBA Show podcast (Episode 581: “5 Players I was wrong about, 20 Games in Contenders, and Sam Vecenie on the 2021 Rookie Class”) and the following statistic caught my attention: … Continue reading →
[Read more...]

What is the Atkinson index?

October 14, 2021 | kjytay

What is the Atkinson index? The Atkinson index, introduced by Atkinson (1970) (Reference 1), is a measure of inequality used in economics. Given a population with values and an inequality-aversion parameter , the Atkinson index is defined as If we … Continue reading →
[Read more...]

Getting predictions from an isotonic regression model

July 29, 2021 | kjytay

TLDR: Pass the output of the isoreg function to as.stepfun to make an isotonic regression model into a black box object that takes in uncalibrated predictions and outputs calibrated ones. Isotonic regression is a method for obtaining a monotonic fit … Continue reading →
[Read more...]

Using different fonts with ggplot2

July 8, 2021 | kjytay

I was recently asked to convert all the fonts in my ggplot2-generated figures for a paper to Times New Roman. It turns out that this is easy, but it brought up a whole host of questions that I don’t have … Continue reading →
[Read more...]
1 2 3 5