Articles by Karsten W.

Intrinsic time for cryptocurrency data

January 20, 2019 | Karsten W.

This week, I attended a three-day hacking event of the Crypto Traders Berlin Meetup group. The aim was to find relationships between sentiment data of bitcointalk and twitter and the price of crypto currencies. In practise, it turns out to be not that...
[Read more...]

Age of U.S. President Candidates

January 8, 2016 | Karsten W.

This is a remake of a chart at reddit 6 months ago. I had an idea back then, but did not work it out and now the discussion is closed. The data comes from wikipedia, dimdat and NYT. The graph was created with R, here is the source code. [Read more...]

Consecutive Numbers in Lottery Draws

March 2, 2014 | Karsten W.

A historian, a data scientist, a programmer, a mathematician, and a philosopher discuss the question, how likely it is that a lottery draw (6 out of 49) contains two consecutive numbers. The historian The historian argues that from 1955 up to 2011, there were 5026 lottery draws in Germany, every Saturday, and from 2000 on, two ... [Read more...]

Unit conversion in R

May 17, 2013 | Karsten W.

Last weekend I submitted an update of my R package datamart to CRAN. It has been more than a half year since the last update, however there are only minor advances. The package is still in its early stages, and very experimental.One new feature is the function uconv. Think ... [Read more...]

Some of Excel’s Finance Functions in R

February 16, 2013 | Karsten W.

Last year I took a free online class on finance by Gautam Kaul. I recommend it, although there are other classes I can not compare it to. The instructor took great efforts in motivating the concepts, structuring the material, and enable critical thinking / intuition. I believe this is an advantage ... [Read more...]

ScraperWiki in R

July 29, 2012 | Karsten W.

ScraperWiki describes itself as an online tool for gathering, cleaning and analysing data from the web. It is a programming oriented approach, users can implement ETL processes in Python, PHP or Ruby, share these processes among the community (or pay for privacy) and schedule automated runs. The software behind the ... [Read more...]

Convenient access to Gapminder’s datasets from R

July 16, 2012 | Karsten W.

In April, Hans Rosling examined the influence of religion on fertility. I used R to replicate a graphic of his talk:
> <span>library</span>(datamart)
> gm <- <span>gapminder</span>()
> <span>#queries(gm)</span>
> <span>#</span>
> <span># babies per woman</span>
> tmp <- <span>query</span>(gm, <span>"TotalFertilityRate"</span>)
> babies <- <span>as.vector</span>(tmp[<span>"2008"</span>])
> <span>names</span>(babies) <- <span>names</span>(tmp)
> babies <- babies[!<span>is.na</span>(babies)]
> countries <- <span>names</span>(babies)
> <span>#</span>
> <span># income per capita, PPP adjusted</span>
> tmp <- <span>query</span>(gm, <span>"IncomePerCapita"</span>)
> income <- <span>as.vector</span>(tmp[<span>"2008"</span>])
> <span>names</span>(income) <- <span>names</span>(tmp)
> income <- income[!<span>is.na</span>(income)]
> countries <- <span>intersect</span>(countries, <span>names</span>(income))
> <span>#</span>
> <span># religion</span>
> tmp <- <span>query</span>(gm, <span>"MainReligion"</span>)
> religion <- tmp[,<span>"Group"</span>]
> <span>names</span>(religion) <- tmp[,<span>"Entity"</span>]
> religion[religion==<span>""</span>] <- <span>"unknown"</span>
> colcodes <- <span>c</span>(
+   <span>Christian=</span><span>"blue"</span>, 
+   <span>"Eastern religions"</span>=<span>"red"</span>, 
+   <span>Muslim=</span><span>"green"</span>, <span>"unknown"</span>=<span>"grey"</span>
+ )
> countries <- <span>intersect</span>(countries, <span>names</span>(religion))
> <span>#</span>
> <span># plot</span>
> <span>par</span>(<span>mar=</span><span>c</span>(<span>4</span>,<span>4</span>,<span>0</span>,<span>0</span>)+<span>0.1</span>)
> <span>plot</span>(
+   <span>x=</span>income[countries], 
+   <span>y=</span>babies[countries], 
+   <span>col=</span>colcodes[religion[countries]], 
+   <span>log=</span><span>"x"</span>,
+   <span>xlab=</span><span>"Income per Person, PPP-adjusted"</span>, 
+   <span>ylab=</span><span>"Babies per Woman"</span>
+ )
> <span>legend</span>(
+   <span>"topright"</span>, 
+   <span>legend=</span><span>names</span>(colcodes), 
+   <span>fill=</span>colcodes, 
+   <span>border=</span>colcodes
+ )
One of the points Rosling wanted to make is: Religion has no or very little influence on fertility, but economic welfare has. I wonder if demographs agree and ...
[Read more...]

Querying DBpedia from R

June 24, 2012 | Karsten W.

DBpedia is an extract of structured information from wikipedia. The structured data can be retrieved using an SQL-like query language for RDF called SPARQL. There is already an R package for this kind of queries named SPARQL.There is an S4 class Dbpedia part of my datamart package that aims ... [Read more...]

A wrapper for R’s data() function

June 19, 2012 | Karsten W.

The workflow for statistical analyses is discussed at several places. Often, it is recommended:never change the raw data, but transform it, keep your analysis reproducible, separate functions and data, use R package system as organizing structure. In some recent projects I tried an S4 class approach for this workflow, ... [Read more...]

Working with strings

April 10, 2012 | Karsten W.

R has a lot of string functions, many of them can be found with ls("package:base", pattern="str"). Additionally, there are add-on packages such as stringr, gsubfn and brew that enhance R string processing capabilities. As a statistical language and environment, R has an edge compared to other programming ... [Read more...]

Berlin’s children

February 4, 2012 | Karsten W.

Few years ago, a newspaper claimed the block I live in — Prenzlauer Berg in Berlin — is the most fertile region in Europe. It was a hoax, as this (German) newspaper article points out. (The article has become quite famous because it coined the term Bionade Biedermeier to describe the life ...
[Read more...]

Categorizing my expenses

January 28, 2012 | Karsten W.

In order to analyse my expenses, a classification scheme is necessary. I need to identify categories that are meaningful to me. I decided to go with the “Classification of Individual Consumption by Purpose” (COICOP), for three reasons:It is made by people who have thought more about consumption classification than ...
[Read more...]

Tracking my expenses

January 8, 2012 | Karsten W.

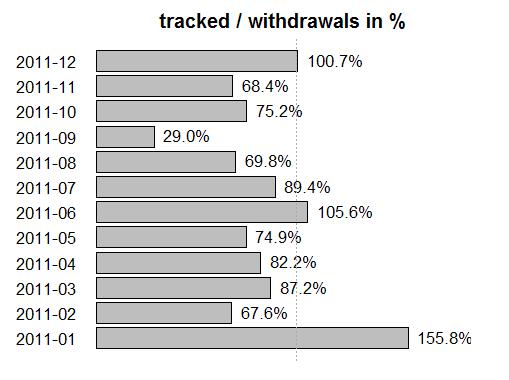
One new-year resolution I made last year was to understand where my money goes. From previous experiments I know that expense tracking has to be as simple as possible. My approach is toUse my cash card as often as possible. This automatically tracks the date and some information on the ...
[Read more...]

How much is a shower?

December 29, 2011 | Karsten W.

After looking at my heating expenses, I turned to the costs for water heating. For some time, I looked at my water meter before and after taking a shower or a bath. Quite often, I forgot one or the other measurement, but I collected about 40 observations. Here is what they ...
[Read more...]

Heating costs

December 28, 2011 | Karsten W.

In 2010, my heating costs exceeded my advance payments by about 25%. This motivated me to decompose the costs to see what drove the changes. Here is the result:The numbers refer to Euros. Read von right to left: 2010 was a cold year (+102EUR), but gas consumption in this house was relatively ...
[Read more...]

Regional differences on what drives CO2 emissions

July 20, 2011 | Karsten W.

If you are investigating the change of CO2 emissions, then you might ask: Where do the changes occur? Well here is the answer.The staircase plots show the contributing factors to CO2 emissions for each continent. population refers to population effects, gdp_pcap refers to income per capita, energy_intensity ...
[Read more...]

Reproducible blogging

July 10, 2011 | Karsten W.

As a fact-based blog, the posts here contain very often diagrams and data tables. To enable you to reproduce the results and insights, I include the computations as computer code.Most blogposts I write are markdown text combined (or weaved) with computer code written in the R language. I created ... [Read more...]

Index decomposition with R

July 9, 2011 | Karsten W.

Few days ago, I finally finished a small package ida. It enables you to analyse contributions of underlying factors to the change in an aggregate, using methods based on index number theory. These methods have become popular by, but are not restricted to, investigating the change of CO2 emissions.Here ...
[Read more...]
1 2

Never miss an update!
Subscribe to R-bloggers to receive
e-mails with the latest R posts.
(You will not see this message again.)

Click here to close (This popup will not appear again)