Handling Outliers with R
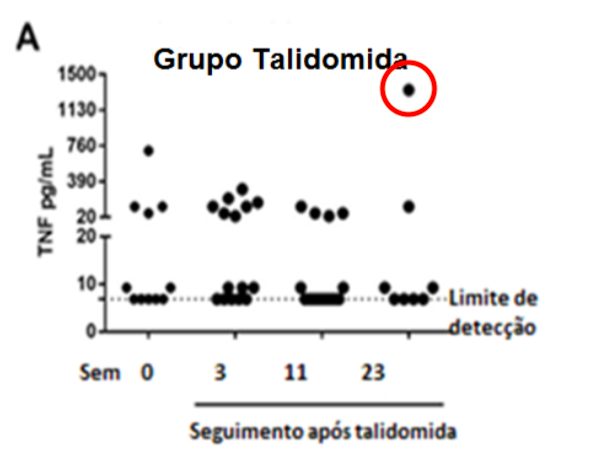
Recently, I attended a presentation where the following graph was shown illustrating the response to stimulation with Thalidomide among a cohort of HIV-1 patients. The biomarker used to measure the response in this case was TNF (tumor necrosis factor) and … Continue reading →


