Articles by hrbrmstr

Pre-CRAN waffle update – isotype pictograms

March 26, 2015 | hrbrmstr

It seems Ruben C. Arslan had the waffle idea about the same time I did. Apart from some extra spiffy XKCD-like styling, one other thing his waffling routines allowed for was using FontAwesome icons. When you use an icon vs a block, you are really making a basic version of ...
[Read more...]

Fixing Colors & Proportions in Jerusalem Post Election Graphics

March 20, 2015 | hrbrmstr

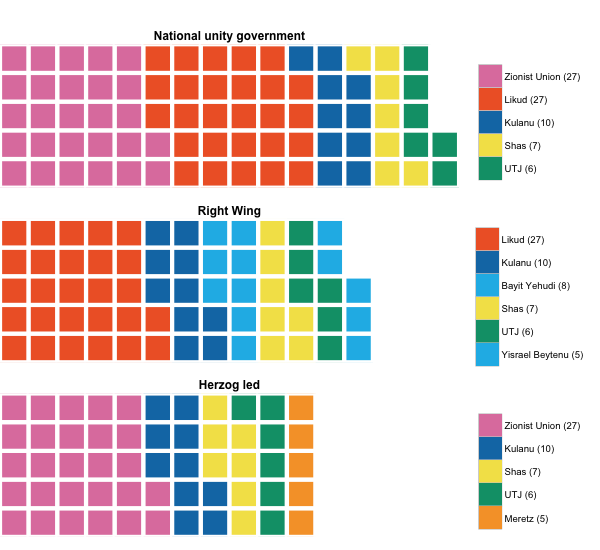
Vis expert Naomi Robbins did an excellent critique of the graphics that went along with an article on Israeli election in the Jerusalem Post. Non-uniform and color-blind-unfriendly categorical colors and disproportionate arc sizes are definitely three substantial issues in that series of visualizations. We can rectify all of them with ...
[Read more...]

Introducing the streamgraph htmlwidget R Package

February 15, 2015 | hrbrmstr

We were looking for a different type of visualization for a project at work this past week and my thoughts immediately gravitated towards streamgraphs. The TLDR on streamgraphs is they they are generalized versions of stacked area graphs with free baselines across the x axis. They are somewhat controversial but ... [Read more...]

SweetheaRstats

February 12, 2015 | hrbrmstr

I felt compelled to dust off my 2013 Valentine’s Day #rstats post and make it all Shiny and new again. I used the same math from that post, but made the polygon a bit sharper and used ggplot2 for the plotting. To kick it up a bit, I decided to ... [Read more...]

A Step to the Right in R Assignments

February 4, 2015 | hrbrmstr

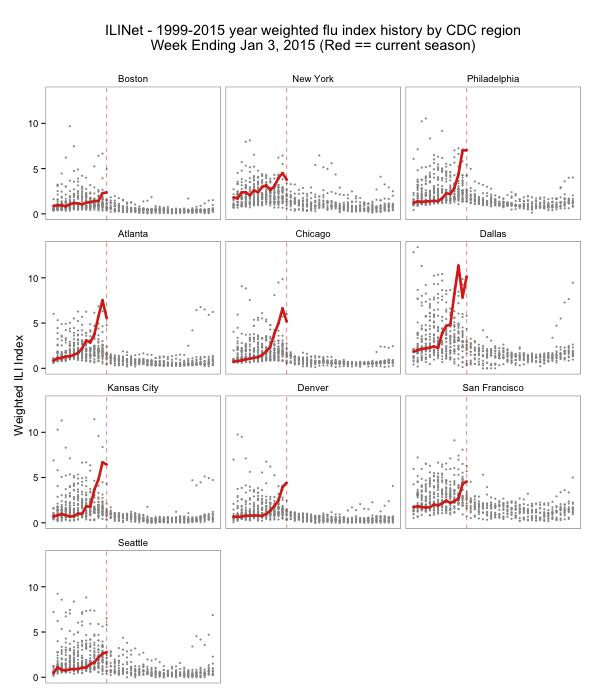
I received an out-of-band question on the use of %% in my CDC FluView post, and took the opportunity to address it in a broader, public fashion. Anyone using R knows that the two most common methods of assignment are the venerable (and sensible) left arrow [Read more...]

New release (0.7) of metricsgraphics htmlwidget — grids & rollovers

February 1, 2015 | hrbrmstr

I’ve updated my metricsgraphics package to version 0.7. The core MetricsGraphics JavaScript library has been updated to version 2.1.0 (from 1.1.0). Two blog-worthy features since releasing version 0.5 are mjs_grid (which is a grid.arrange-like equivalent for metricsgraphics plots and mjs_add_rollover which lets you add your own custom rollover text ... [Read more...]

New R Package: metricsgraphics

January 8, 2015 | hrbrmstr

Mozilla released the MetricsGraphics.js library back in November of 2014 (gh repo) and was greeted with great fanfare. It’s primary focus is on crisp, clean layouts for interactive time-series data, but they have support for other chart types as well (though said support is far from comprehensive). I had ... [Read more...]

Moving The Earth (well, Alaska & Hawaii) With R

November 16, 2014 | hrbrmstr

In a previous post we looked at how to use D3 TopoJSON files with R and make some very D3-esque maps. I mentioned that one thing missing was moving Alaska & Hawaii a bit closer to the continental United States and this post shows you how to do that. The ... [Read more...]

Plot Me Like a Hurricane (a.k.a. animating historical North Atlantic basin tropical storm tracks)

October 7, 2014 | hrbrmstr

Markus Gessman (@MarkusGesmann) did a beautiful job Visualising the seasonality of Atlantic windstorms using small multiples, which was inspired by both a post by Arthur Charpentier (@freakonometrics) on using Markov spatial processes to “generate” hurricanes—which was tweaked a bit by Robert Grant (@robertstats)—and Gaston Sanchez‘s Visualizing Hurricane ... [Read more...]
1 18 19 20 21 22 23

Never miss an update!
Subscribe to R-bloggers to receive
e-mails with the latest R posts.
(You will not see this message again.)

Click here to close (This popup will not appear again)