Articles by hrbrmstr

A Step to the Right in R Assignments

February 4, 2015 | hrbrmstr

I received an out-of-band question on the use of %% in my CDC FluView post, and took the opportunity to address it in a broader, public fashion. Anyone using R knows that the two most common methods of assignment are the venerable (and sensible) left arrow [Read more...]

New release (0.7) of metricsgraphics htmlwidget — grids & rollovers

February 1, 2015 | hrbrmstr

I’ve updated my metricsgraphics package to version 0.7. The core MetricsGraphics JavaScript library has been updated to version 2.1.0 (from 1.1.0). Two blog-worthy features since releasing version 0.5 are mjs_grid (which is a grid.arrange-like equivalent for metricsgraphics plots and mjs_add_rollover which lets you add your own custom rollover text ... [Read more...]

New R Package: metricsgraphics

January 8, 2015 | hrbrmstr

Mozilla released the MetricsGraphics.js library back in November of 2014 (gh repo) and was greeted with great fanfare. It’s primary focus is on crisp, clean layouts for interactive time-series data, but they have support for other chart types as well (though said support is far from comprehensive). I had ... [Read more...]

Moving The Earth (well, Alaska & Hawaii) With R

November 16, 2014 | hrbrmstr

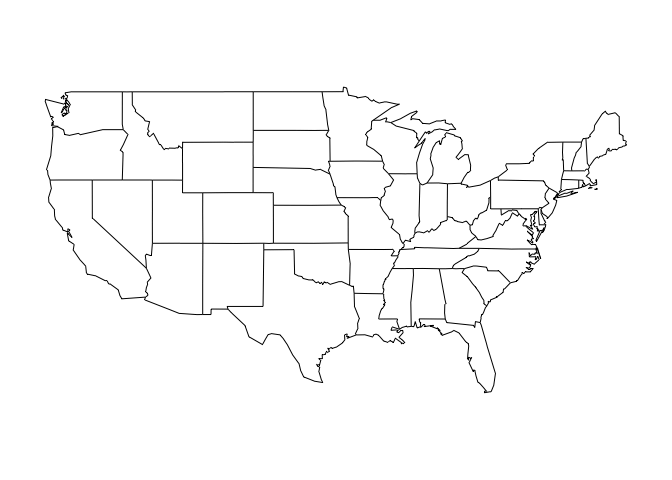
In a previous post we looked at how to use D3 TopoJSON files with R and make some very D3-esque maps. I mentioned that one thing missing was moving Alaska & Hawaii a bit closer to the continental United States and this post shows you how to do that. The ... [Read more...]

Plot Me Like a Hurricane (a.k.a. animating historical North Atlantic basin tropical storm tracks)

October 7, 2014 | hrbrmstr

Markus Gessman (@MarkusGesmann) did a beautiful job Visualising the seasonality of Atlantic windstorms using small multiples, which was inspired by both a post by Arthur Charpentier (@freakonometrics) on using Markov spatial processes to “generate” hurricanes—which was tweaked a bit by Robert Grant (@robertstats)—and Gaston Sanchez‘s Visualizing Hurricane ... [Read more...]

Overcoming D3 Cartographic Envy With R + ggplot

September 25, 2014 | hrbrmstr

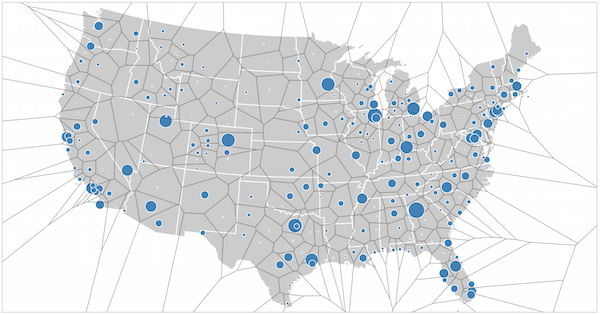
When I used one of the Scotland TopoJSON files for a recent post, it really hit me just how much D3 cartography envy I had/have as an R user. Don’t get me wrong, I can conjure up D3 maps pretty well [1] [2] and the utility of an interactive map ... [Read more...]

Seeing the (day)light with R

September 23, 2014 | hrbrmstr

The arrival of the autumnal equinox foreshadows the reality of longer nights and shorter days here in the northeast US. We can both see that reality and distract ourselves from it at the same time by firing up RStudio (or your favorite editor) and taking a look at the sunrise & ...
[Read more...]

Rforecastio Package Update (1.1.0)

May 4, 2014 | hrbrmstr

I’ve bumped up the version number of Rforecastio (github) to 1.1.0. The new features are: removing the SSL certificate bypass check (it doesn’t need it anymore) using plyr for easier conversion of JSON-__data frame adding in a new daily forecast data frame roxygen2 inline documentation library(Rforecastio) library(...
[Read more...]

Moving From system() calls to Rcpp Interfaces

April 23, 2014 | hrbrmstr

Over on the Data Driven Security Blog there’s a post on how to use Rcpp to interface with an external library (in this case ldns for DNS lookups). It builds on another post which uses system() to make a call to dig to lookup DNS TXT records. The core ... [Read more...]

Mapping the March 2014 California Earthquake with ggmap

April 1, 2014 | hrbrmstr

I had no intention to blog this, but @jayjacobs convinced me otherwise. I was curious about the recent (end of March, 2014) California earthquake “storm” and did a quick plot for “fun” and personal use using ggmap/ggplot. I used data from the Southern California Earthquake Center (that I cleaned up ... [Read more...]

Guardian Words: Visualized

March 15, 2014 | hrbrmstr

Andy Kirk (@visualisingdata) & Lynn Cherny (@arnicas) tweeted about the Guardian Word Count service/archive site, lamenting the lack of visualizations: Want to know num of words written in each day's Guardian paper by section + approx reading time? http://t.co/wP4W1EzUsx via @bengoldacre— Andy Kirk (@visualisingdata) March 15, 2014 This ... [Read more...]
1 17 18 19 20 21

Never miss an update!
Subscribe to R-bloggers to receive
e-mails with the latest R posts.
(You will not see this message again.)

Click here to close (This popup will not appear again)