Articles by hrbrmstr

Two pending features to metricsgraphics

July 5, 2015 | hrbrmstr

I’ve been slowly prodding the metricsgraphics package towards a 1.0.0 release, but there are some rough edges that still need sorting out. One of them is the ability to handle passing in variables for the x & y accessor values (you can pass in bare and quoted strings). This can now ... [Read more...]

DO Something Nifffty with R

June 19, 2015 | hrbrmstr

@briandconnelly (of pushoverr fame) made a super-cool post about connecting R to @IFTTT via IFTTT’s “Maker” channel. The IFTTT Maker interface to receive events is fairly straightforward and Brian’s code worked flawlessly, so it was easy to tweak a bit and wrap into a package. To get started, ...
[Read more...]

metricsgraphics 0.8.5 is now on CRAN!

June 15, 2015 | hrbrmstr

I’m super-pleased to announce that the Benevolent CRAN Overlords accepted the metricsgraphics package into CRAN over the weekend. Now, you no longer need to rely on github/devtools to use MetricsGraphics.js charts from your R scripts. If you’re not familiar with htmlwidgets, take a look at the ... [Read more...]

Animated US Hexbin Map of the Avian Flu Outbreak

June 7, 2015 | hrbrmstr

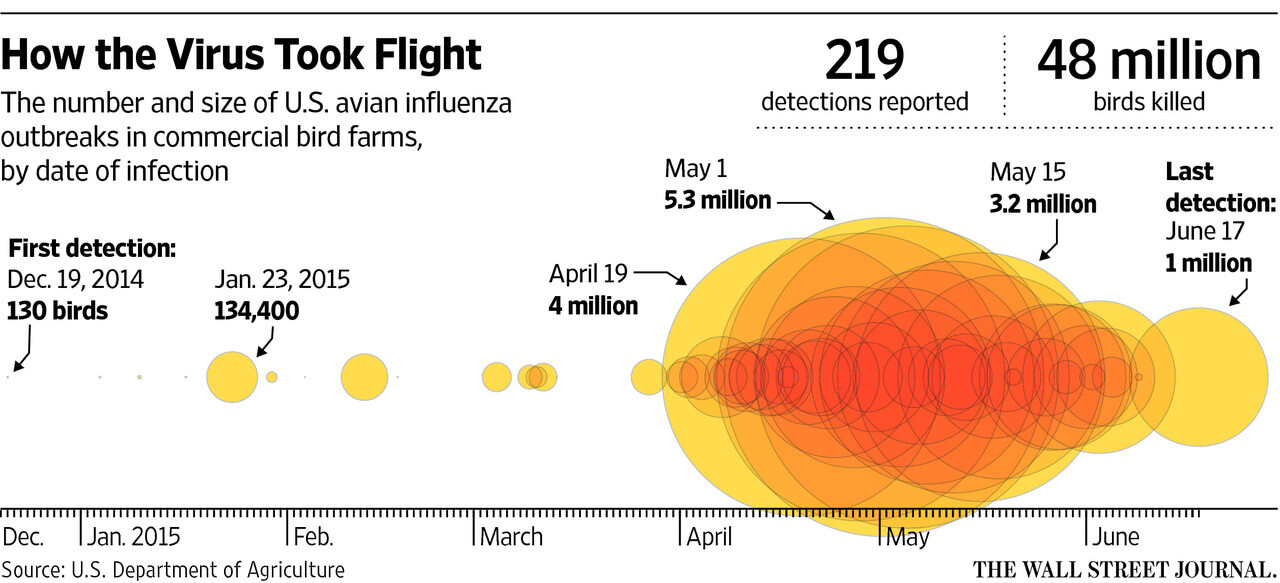
The recent announcement of the start of egg rationing in the U.S. made me curious enough about the avian flu outbreak to try to dig into the numbers a bit. I finally stumbled upon a USDA site that had an embedded HTML table of flock outbreak statistics by state, ... [Read more...]

Scraping jQuery DataTable Programmatic JSON with R

May 18, 2015 | hrbrmstr

School of Data had a recent post how to copy “every item” from a multi-page list. While their post did provide a neat hack, their “words of warning” are definitely missing some items and the overall methodology can be improved upon with some basic R scripting. First, the technique they ...
[Read more...]

U.S. Drought Monitoring With Hexbin State Maps in R

May 15, 2015 | hrbrmstr

On the news, today, of the early stages of drought hitting the U.S. northeast states I decided to springboard off of yesterday’s post and show a more practical use of hexbin state maps than the built-in (and still purpose unknown to me) “bees” data. The U.S. Drought ...
[Read more...]

GeoJSON Hexagonal “Statebins” in R

May 14, 2015 | hrbrmstr

There’s been lots of buzz about “statebin” maps of late. A recent tweet by @andrewxhill referencing work by @dannydb pointed to a nice shapefile that ends up being a really great way to handle statebin maps (and I feel like a fool for not considering it for a more ...
[Read more...]

More Airline Crashes via the Hadleyverse

March 31, 2015 | hrbrmstr

I saw a fly-by #rstats mention of more airplane accident data on — of all places — LinkedIn (email) today which took me to a GitHub repo by @philjette. It seems there’s a web site (run by what seems to be a single human) that tracks plane crashes. Here’s a ... [Read more...]

rud.is » R 2015-03-30 13:32:08

March 30, 2015 | hrbrmstr

Over on The DO Loop, @RickWicklin does a nice job visualizing the causes of airline crashes in SAS using a mosaic plot. More often than not, I find mosaic plots can be a bit difficult to grok, but Rick’s use was spot on and I believe it shows the ...
[Read more...]

Pre-CRAN waffle update – isotype pictograms

March 26, 2015 | hrbrmstr

It seems Ruben C. Arslan had the waffle idea about the same time I did. Apart from some extra spiffy XKCD-like styling, one other thing his waffling routines allowed for was using FontAwesome icons. When you use an icon vs a block, you are really making a basic version of ...
[Read more...]

Fixing Colors & Proportions in Jerusalem Post Election Graphics

March 20, 2015 | hrbrmstr

Vis expert Naomi Robbins did an excellent critique of the graphics that went along with an article on Israeli election in the Jerusalem Post. Non-uniform and color-blind-unfriendly categorical colors and disproportionate arc sizes are definitely three substantial issues in that series of visualizations. We can rectify all of them with ...
[Read more...]

Introducing the streamgraph htmlwidget R Package

February 15, 2015 | hrbrmstr

We were looking for a different type of visualization for a project at work this past week and my thoughts immediately gravitated towards streamgraphs. The TLDR on streamgraphs is they they are generalized versions of stacked area graphs with free baselines across the x axis. They are somewhat controversial but ... [Read more...]

SweetheaRstats

February 12, 2015 | hrbrmstr

I felt compelled to dust off my 2013 Valentine’s Day #rstats post and make it all Shiny and new again. I used the same math from that post, but made the polygon a bit sharper and used ggplot2 for the plotting. To kick it up a bit, I decided to ... [Read more...]
1 16 17 18 19 20 21

Never miss an update!
Subscribe to R-bloggers to receive
e-mails with the latest R posts.
(You will not see this message again.)

Click here to close (This popup will not appear again)