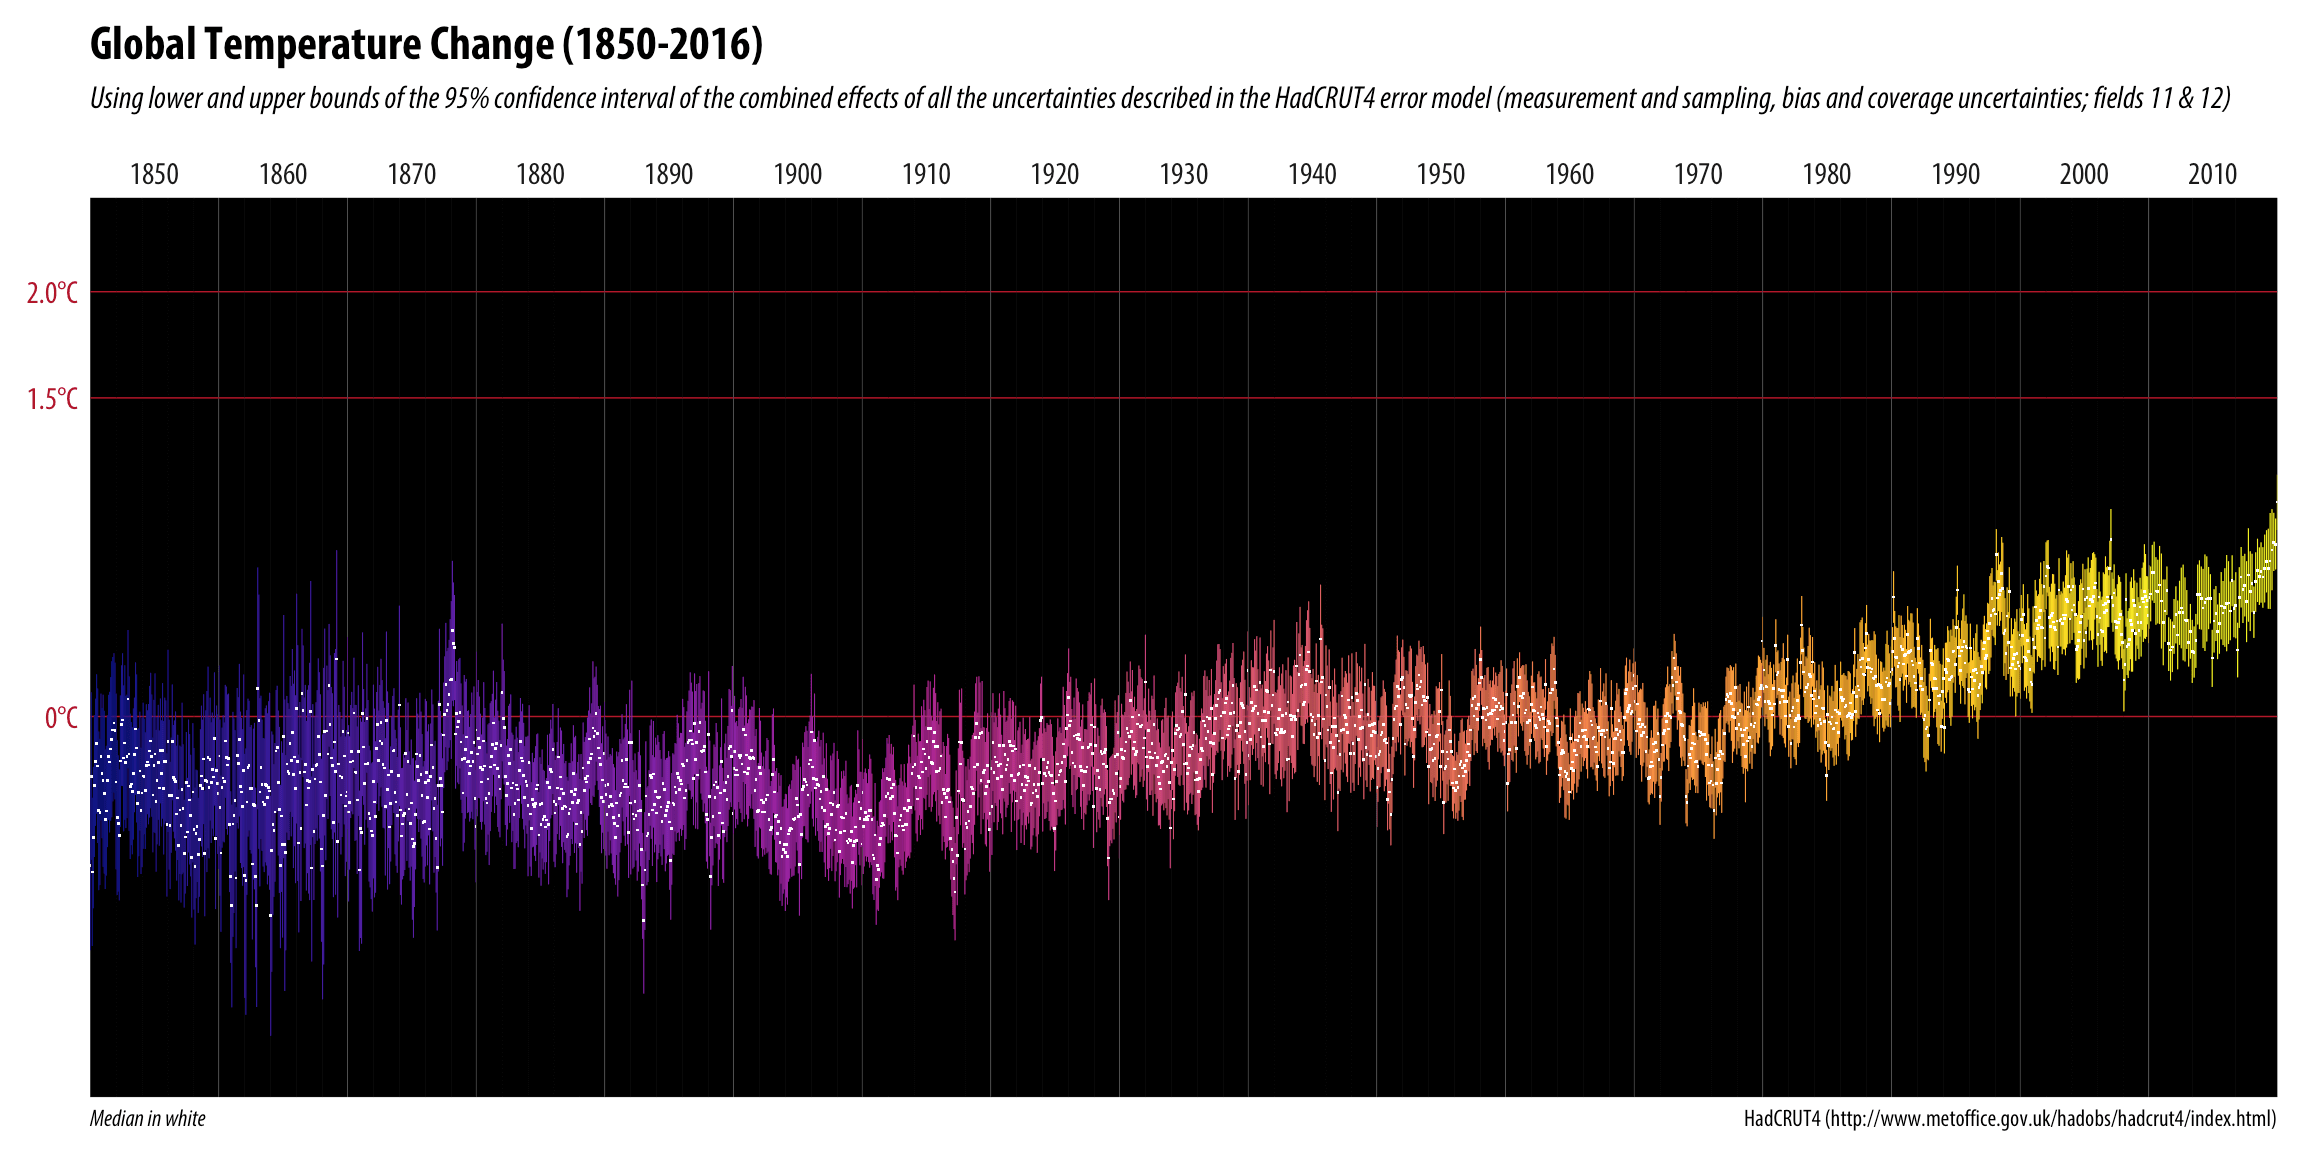
Global Temperature Change in R & D3 (without the vertigo)
This made the rounds on social media last week: Spiraling global temperatures from 1850-2016 (full animation) https://t.co/YETC5HkmTr pic.twitter.com/Ypci717AHq— Ed Hawkins (@ed_hawkins) May 9, 2016 One of the original versions was static and was not nearly as popular, but—as you can see—this ...