
Articles by Higher Order Functions
Our group has started using a new knowledge base system, so I have been
writing up and revisiting some of my documentation. Here I am going to
share a guide I wrote about citing R packages in academic writing.
Which software to cite
Let’s make a dist... [Read more...]
Ordering constraints in brms using contrast coding
Mattan S. Ben-Shachar wrote an excellent tutorial
about how to impose ordering constraints in Bayesian regression models.
In that post, the data comes from archaeology
(Buck, 2017). We have samples from
Layers in a site, and for each sample, we have a ...
How to score Rock Paper Scissors
Ho ho ho, it is the most wonderful time of the year: Advent of code!
AOC is a yearly collection of programming puzzles throughout the
first 25 days of December. I like it… so much so that I wrote an R
package for completing my puzzles using
the struct...
Creating a Summoning Salt-style speedrun plot
A videogame speedrun is a challenge to beat the game as quickly as
possible. It’s time attack racing but for a videogame. There are, in my
mind, two ways to make a run’s time go faster: Playing better and more
smoothly (optimizations, having better luc...

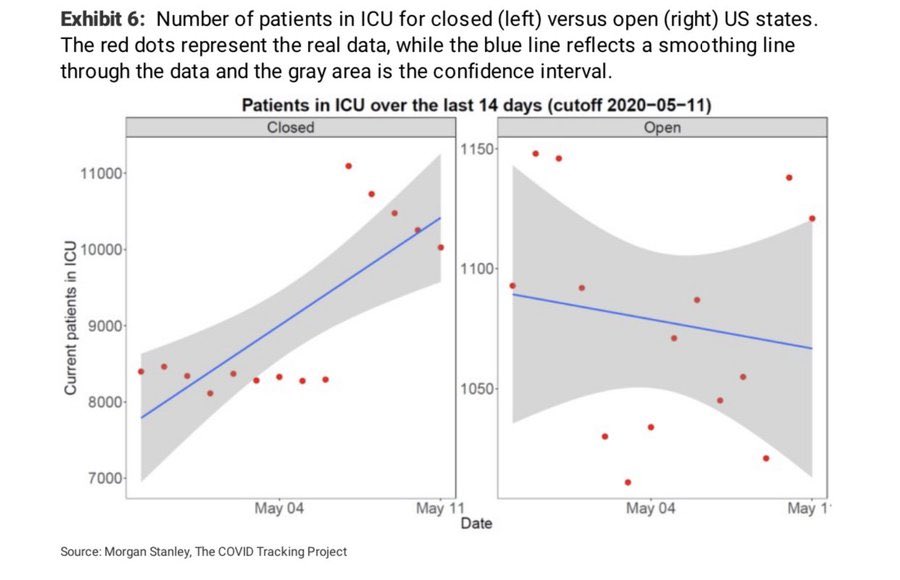
The cursed Morgan Stanley Covid-19 visualization
Darren Dahly, username @statsepi, asked
people on Twitter to share some of their favorite or least favorite data
visualizations from the pandemic. I nominated the notorious “cubic fit”
‘forecast’
from the Council of Economic Advisers. But then there wa...
Self-documenting plots in ggplot2
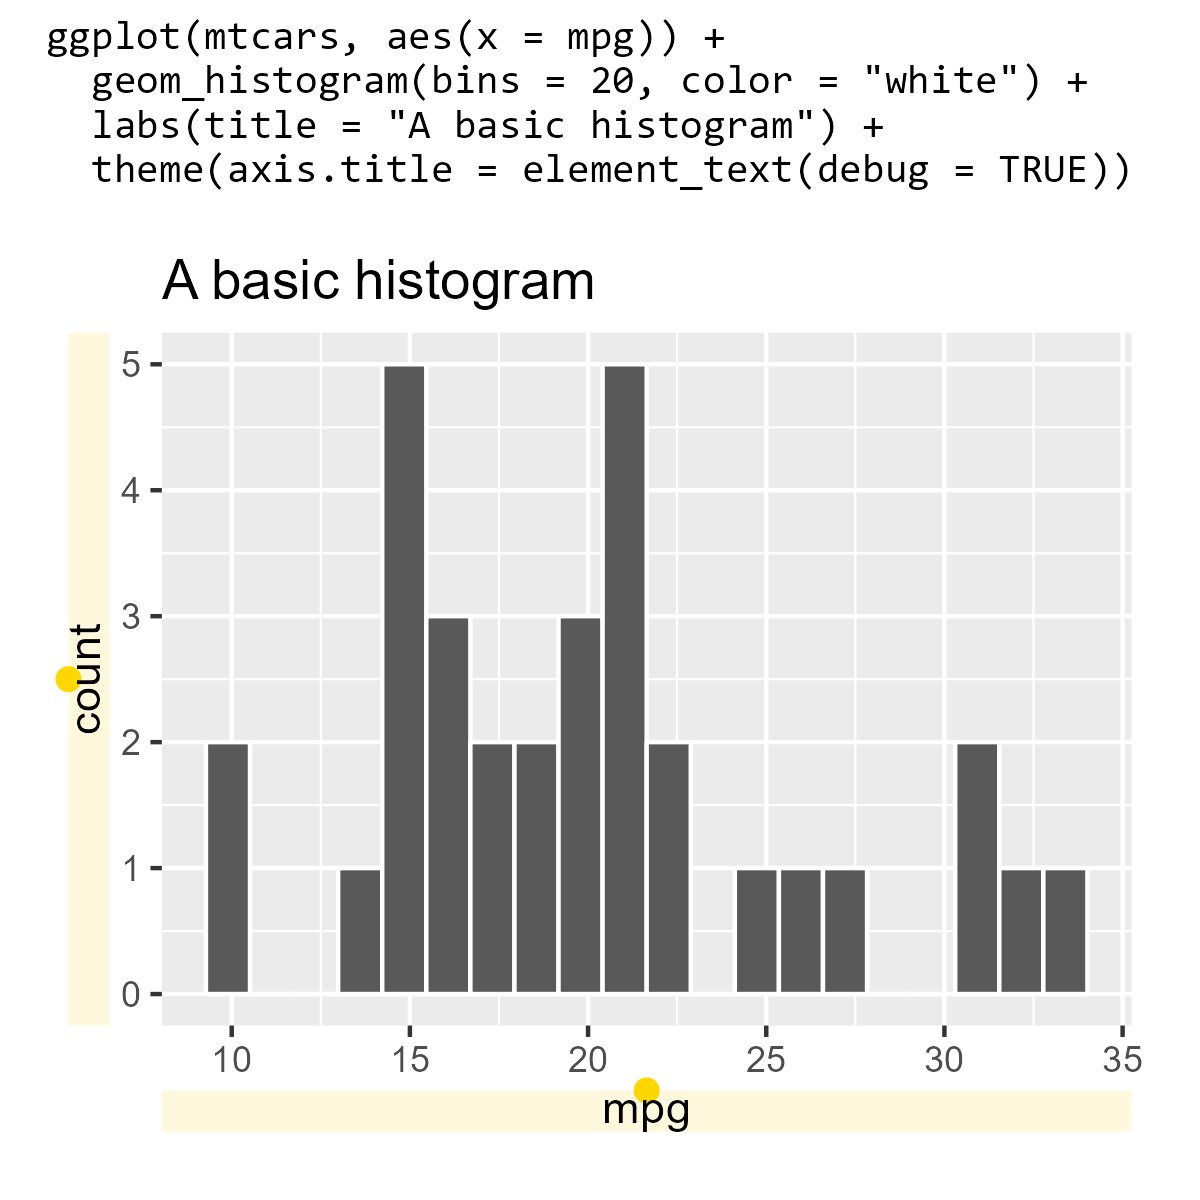
When I am showing off a plotting technique in
ggplot2, I sometimes like to include
the R code that produced the plot as part of the plot. Here is an
example I made to demonstrate the debug parameter in
element_text():
library(ggplot2)
self_document(
...
Custom syntax highlighting themes in RMarkdown (and pandoc)
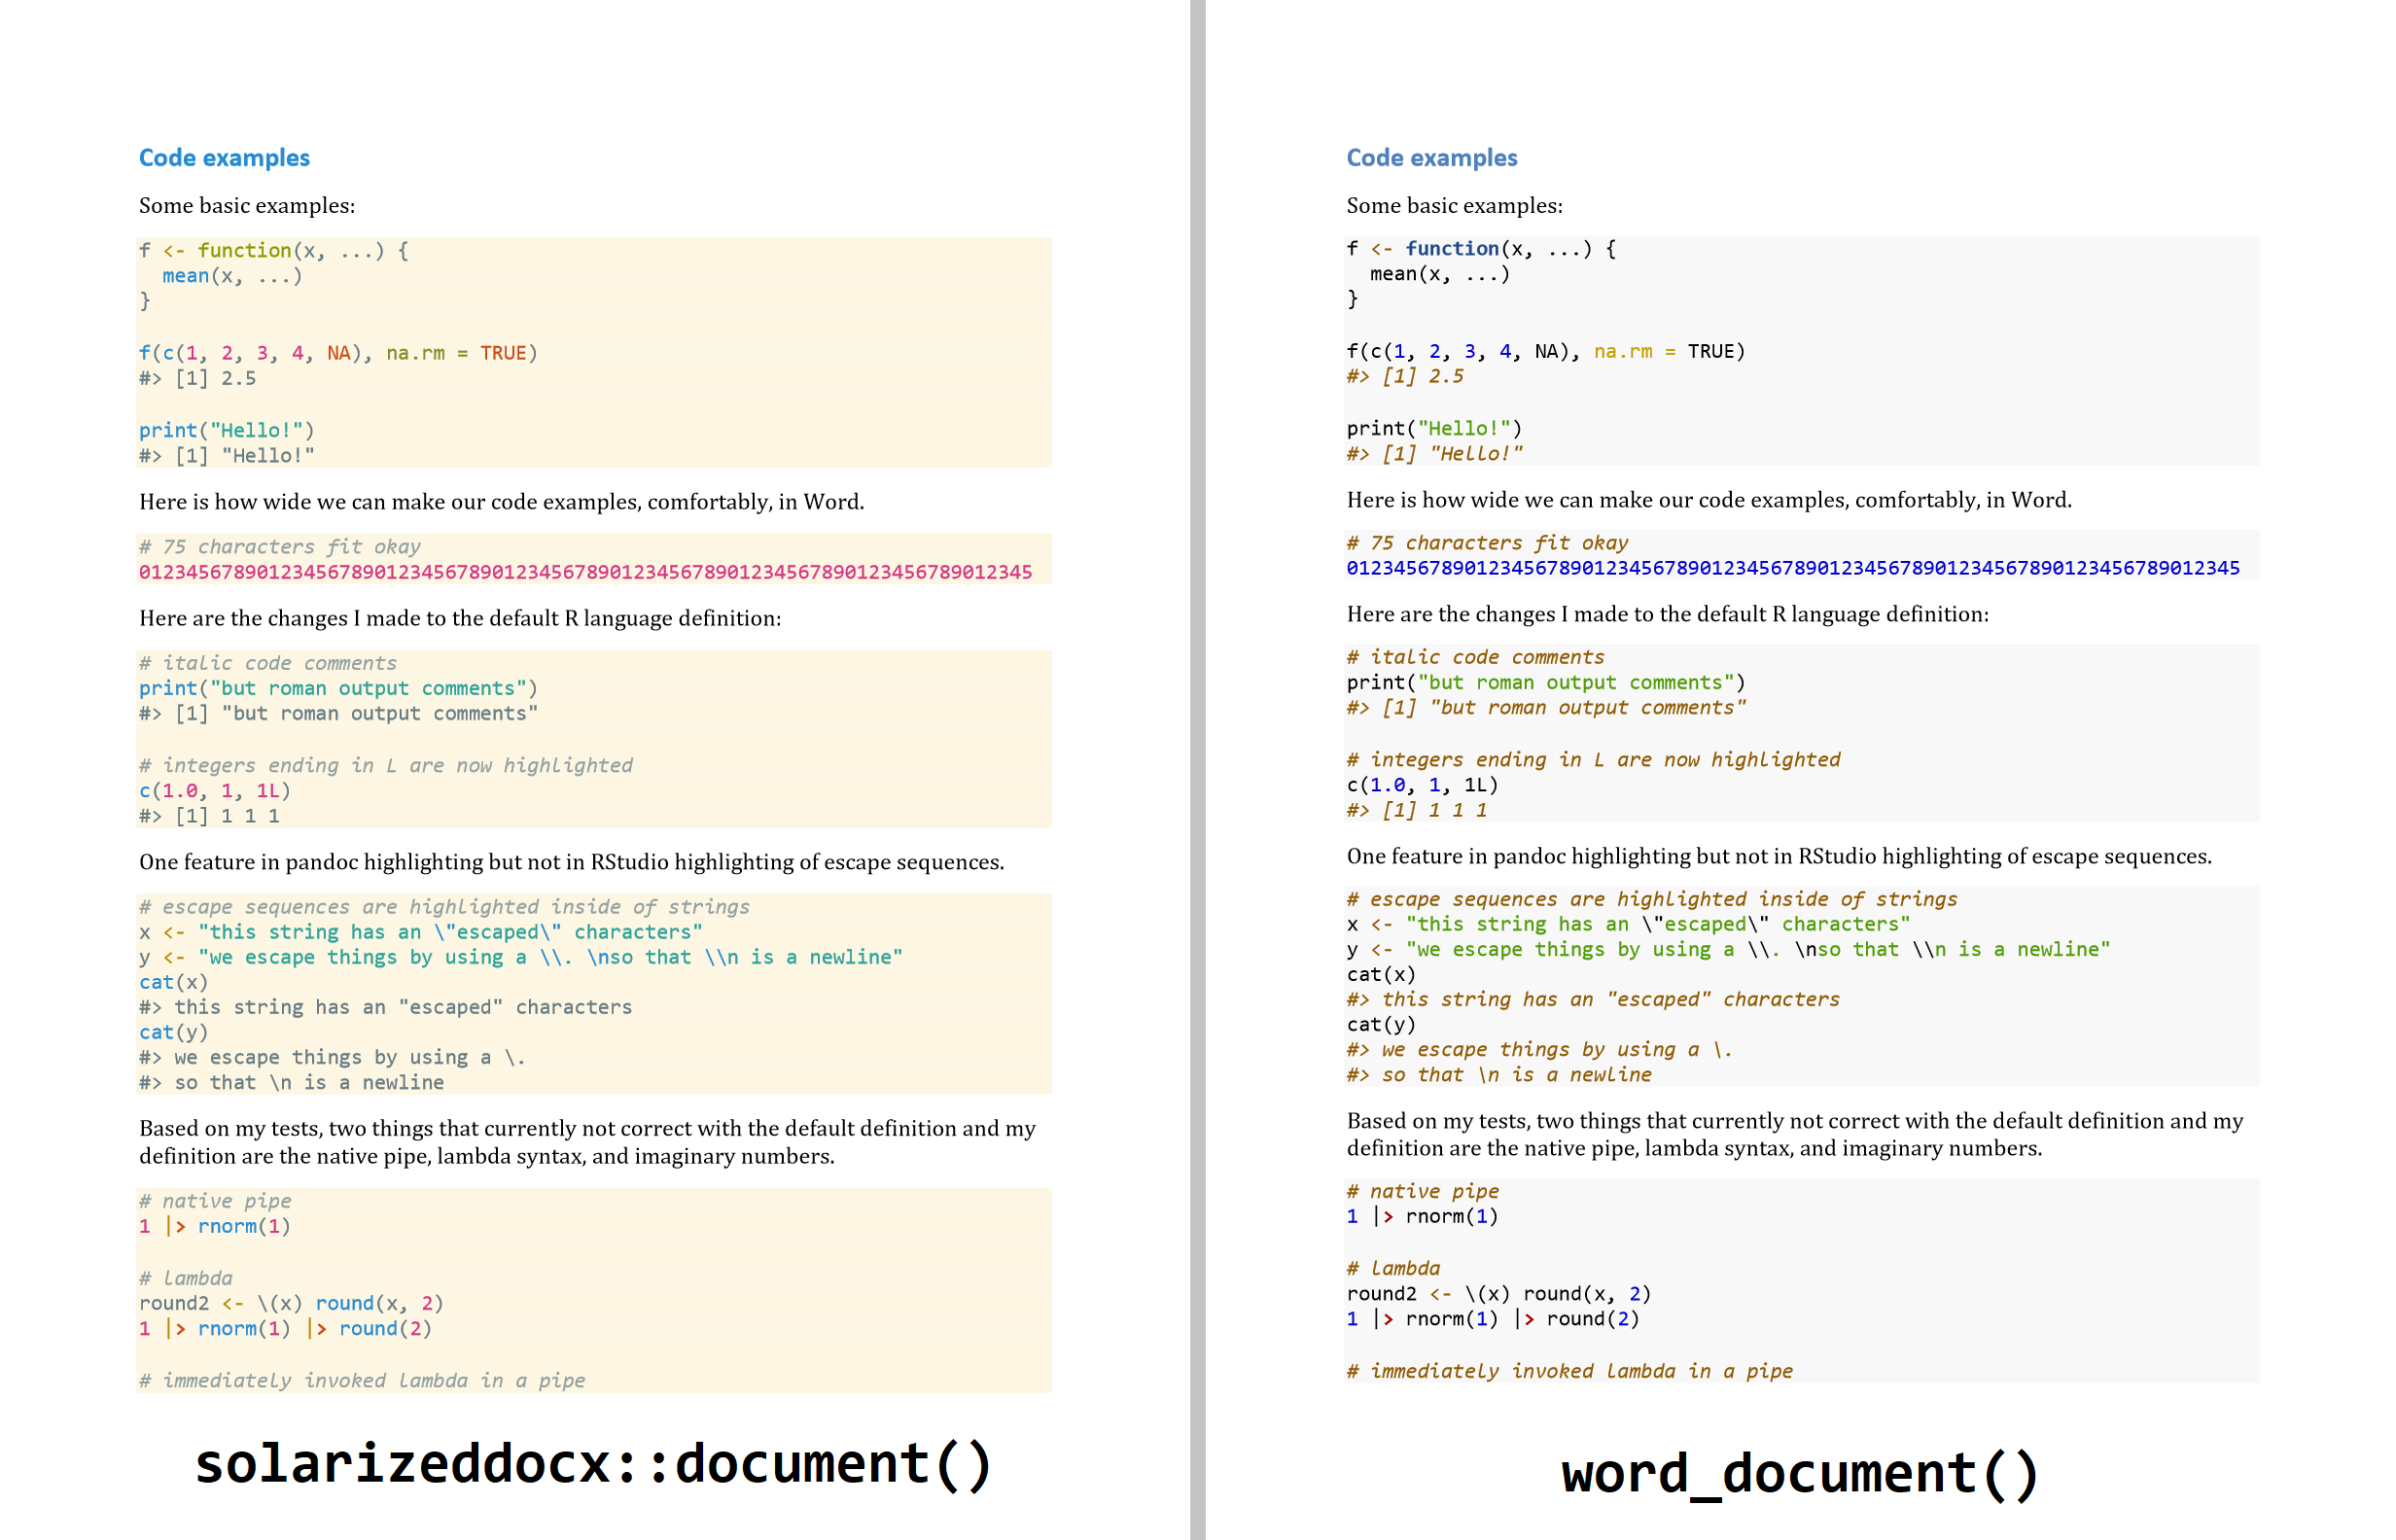
I recently developed and released an R package called
solarizeddocx. It provides solarizeddocx::document(), an
RMarkdown output format for
solarized-highlighted Microsoft Word documents . The image below
shows a comparison of the solarizeddocx and the ...
A one-liner for generating random participant IDs
On one of the Slacks I browse, someone asked how to de-identify a
column of participant IDs. The original dataset was a wait list, so
the ordering of IDs itself was a sensitive feature of the data and we
need to scramble the order of IDs produced.
For... [Read more...]
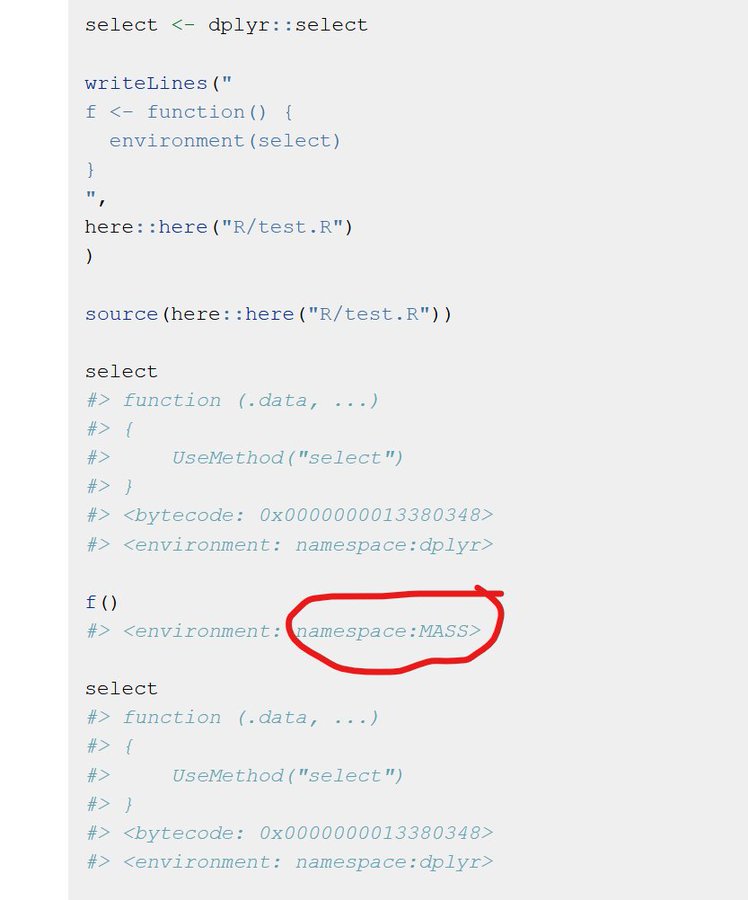
Keep your R scripts locally sourced
A few weeks ago, I had a bad debugging session. The code was just not
doing what I expected, and I went down a lot of deadends trying to fix
or simplify things. I could not get the problem to happen in a
reproducible example (reprex) or
interactively (in RStudio). ...
Snecko eye lets you play more cards
In a previous post, I used simulations
to estimate how long it would take to collect the unique Unowns in
Pokemon Go! The message of the post was that we can use simulations
to solve problems when the analytic solution is not clear or obvious.
The curr...
Think of `&&` as a stricter `&`
In programming languages, we find logical operators for and
and or. In fact, Python uses the actual words and and or
for these operators.
# Python via the reticulate package
x = True
y = False
x and y
#__ False
x or y
#__ True
In Javascript, we ... [Read more...]
Random effects and penalized splines are the same thing
For a long time, I’ve been curious about something. It is a truth I’ve
seen casually dropped in textbooks, package documentation, and tweets:
random effects and penalized smoothing splines are the same thing.
It sounds so profound and enlightened. Wha...

Lists are my secret weapon for reporting stats with knitr
I am going to describe my favorite knitr trick: Using lists to simplify inline reporting. Trick might not do it justice. I consider this a best practice for working with knitr.
Plug it in
Inline reporting lets you insert R expressions inside of
markd... [Read more...]
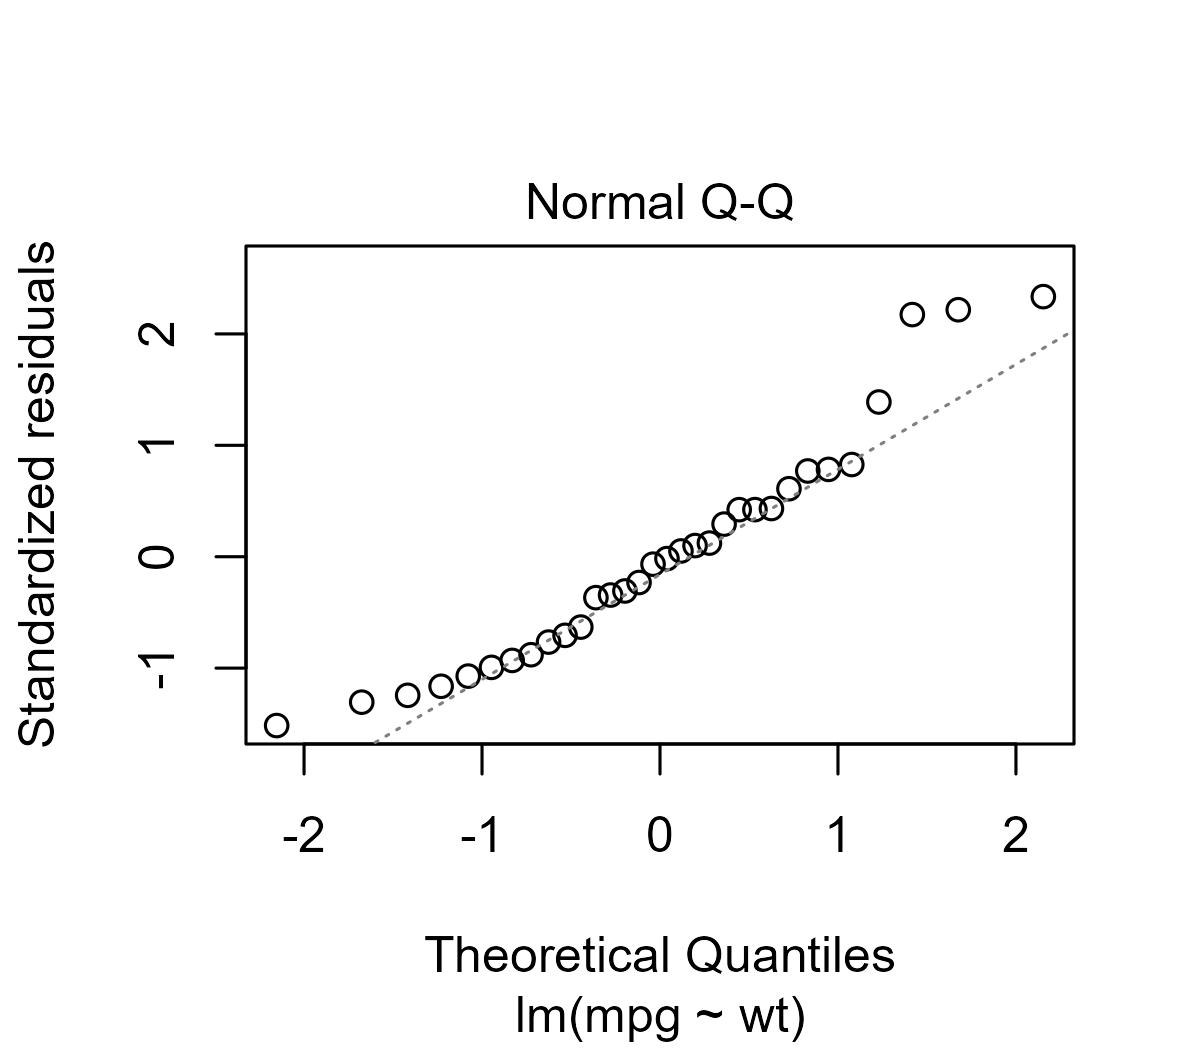
Q-Q Plots and Worm Plots from Scratch
One of the things I have come to appreciate is how programming is a great way to
learn statistics. My eyes will glaze over at a series of equations in a
derivation, but ask me to program the procedure and I’ll never forget how it works.
This post will ...
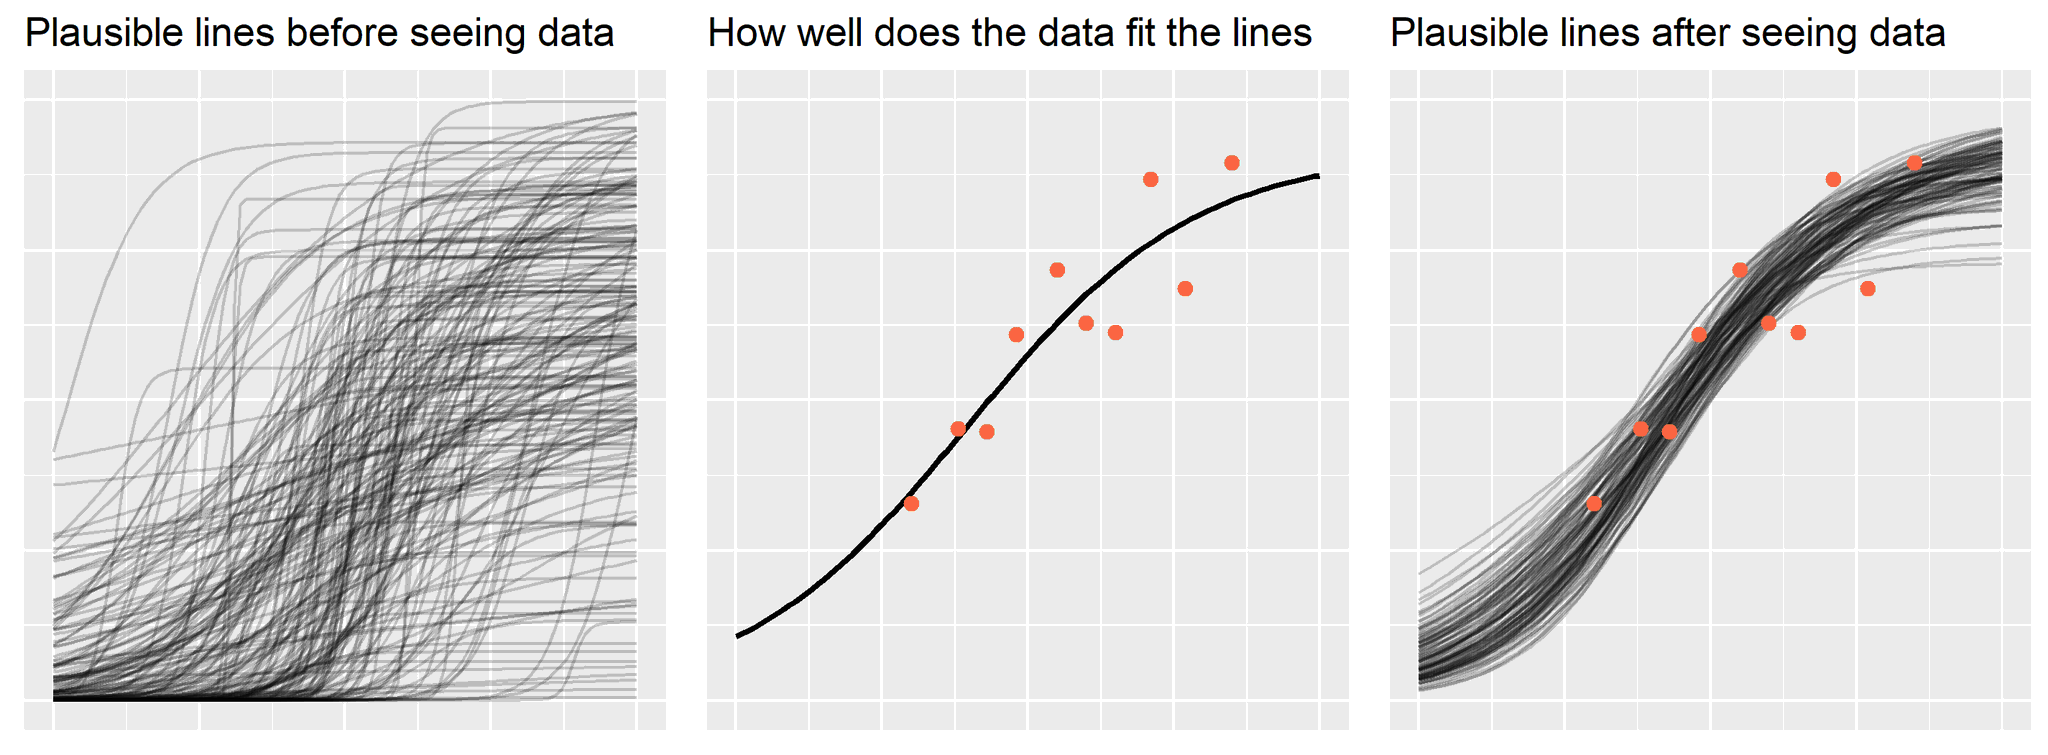
Bayes’ theorem in three panels
In my last post, I walked through
an intuition-building visualization I created to describe mixed-effects models
for a nonspecialist audience. For that presentation, I also created an analogous
visualization to introduce Bayes’ Theorem, so here I will walk through that
figure..
As in the earlier post, let’s start by ...
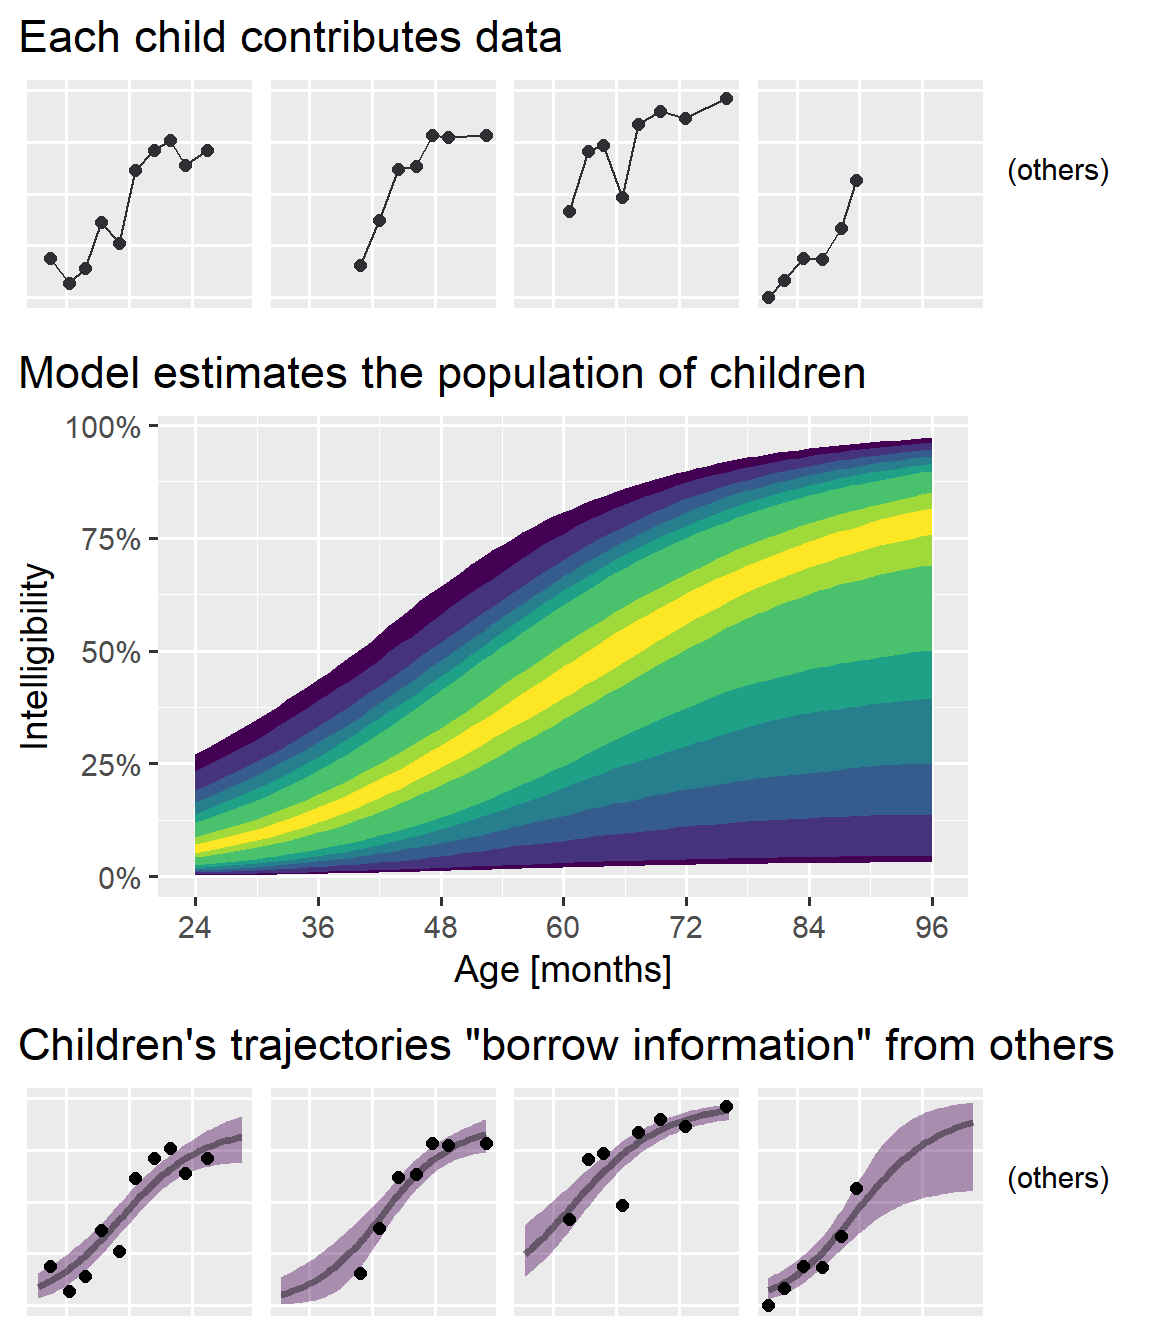
Another mixed effects model visualization
Last week, I presented an analysis on the longitudinal development of
intelligibility in children with cerebral palsy—that is, how well do strangers
understand these children’s speech from 2 to 8 years old. My analysis used a
Bayesian nonlinear mixed effects Beta regression model. If some models are livestock and some ...
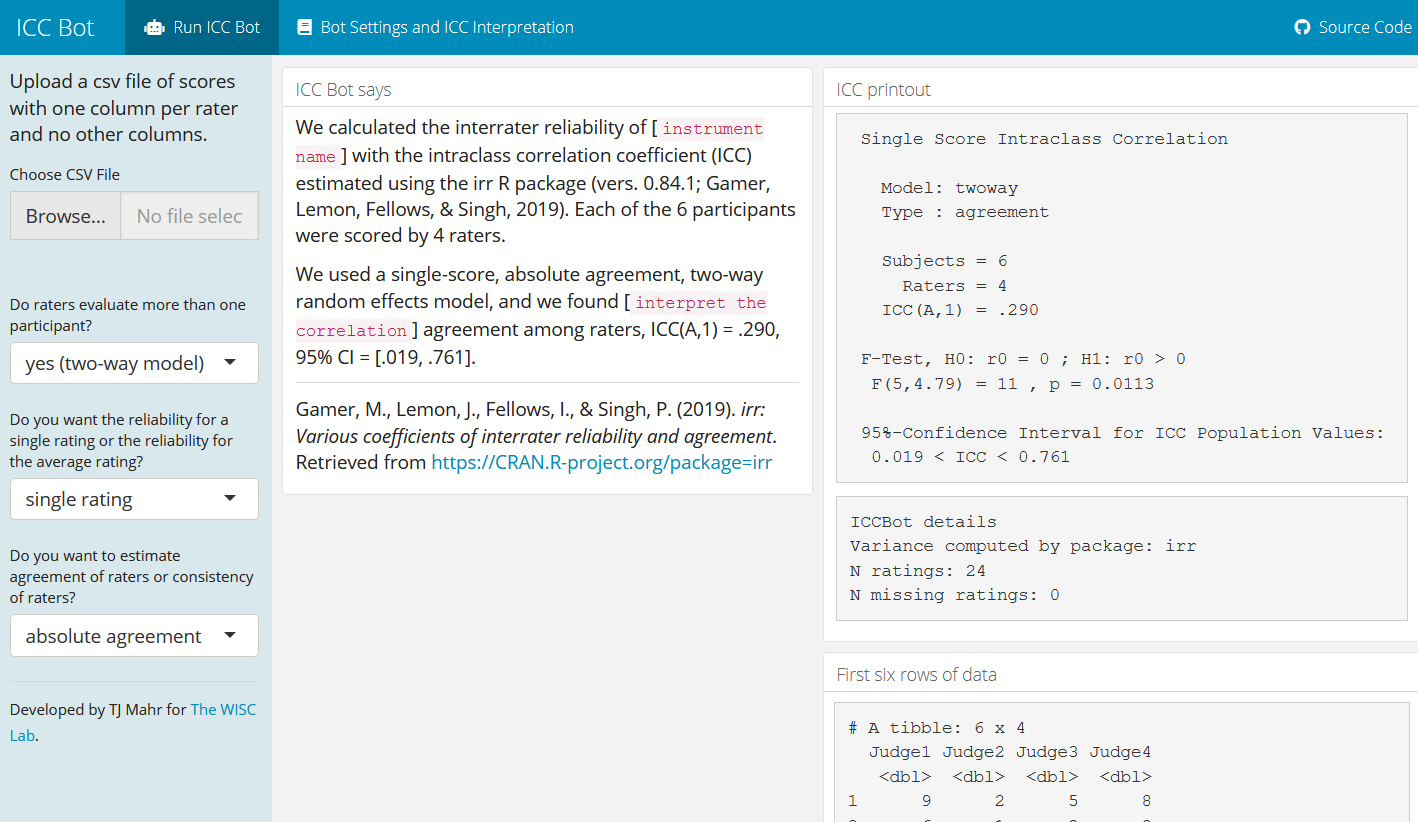
ICC Bot comes online
I am happy to announce the release of ICC Bot, an app for computing
interrater reliability scores using the intraclass correlation coefficient
(ICC).
A screenshot of ICC Bot, an interactive app for computing intraclass correlation coefficients.
The ICC statistic appears in repeated measures or multilevel modeling
literature as a way ...
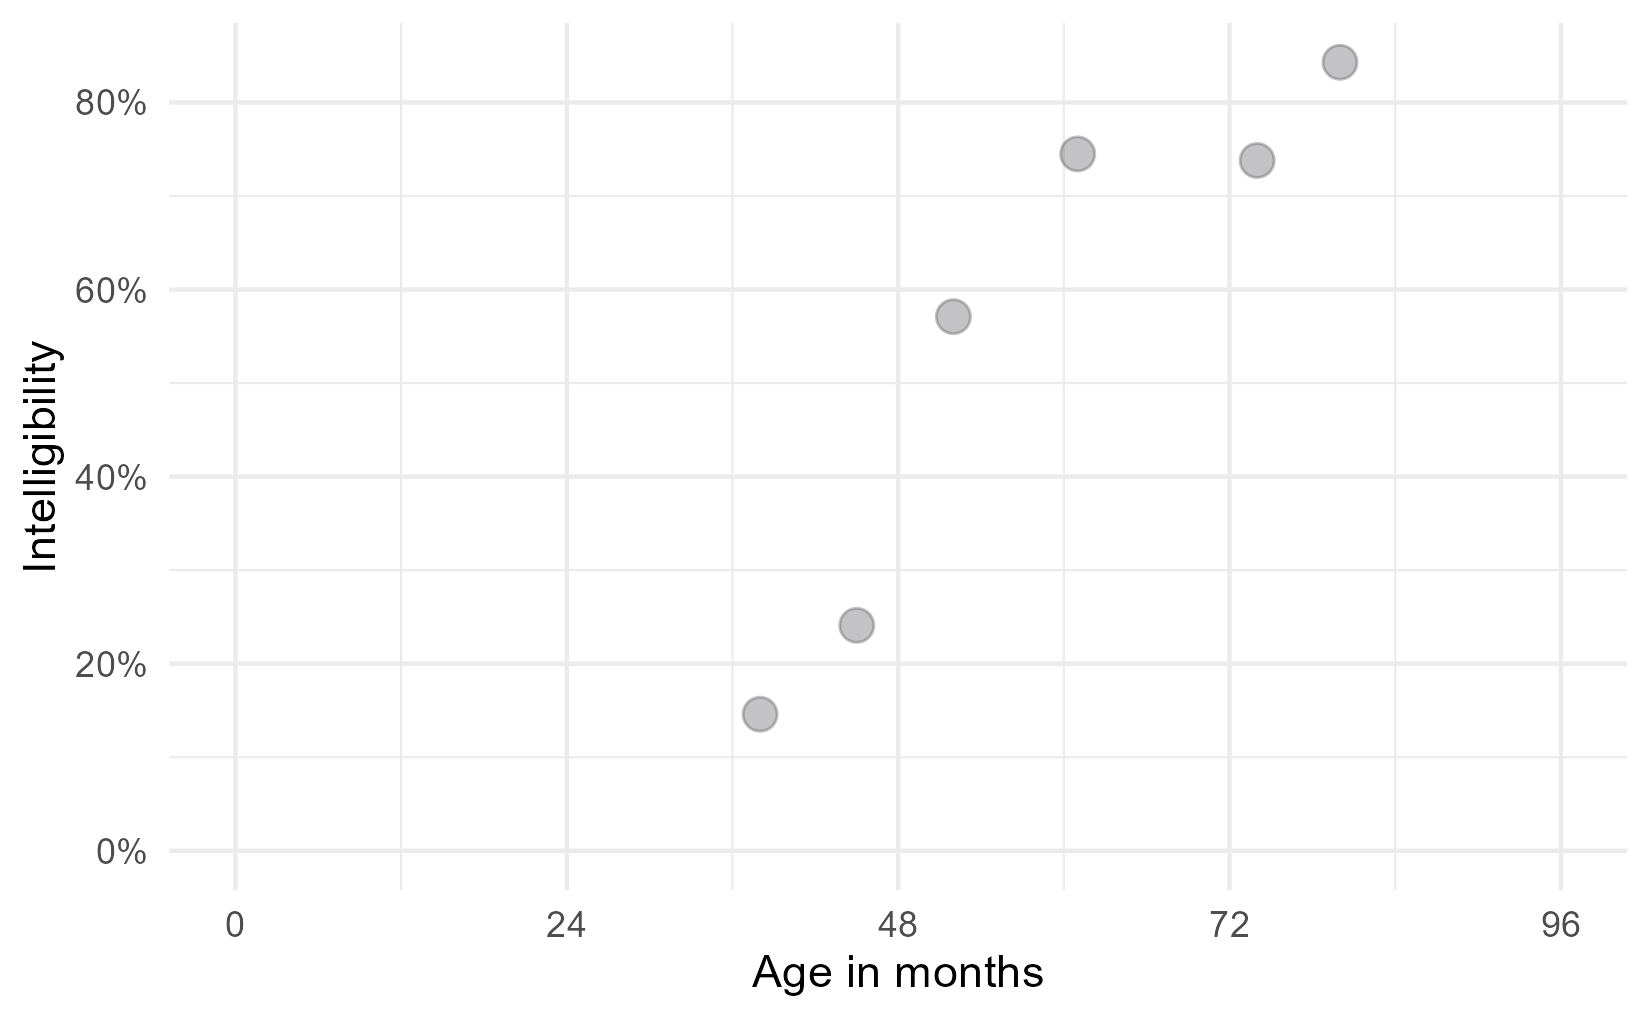
Anatomy of a logistic growth curve
In this post, I walk through the code I used to make a nice diagram illustrating
the parameters in a logistic growth curve. I made this figure for a conference
submission. I had a tight word limit (600 words) and a complicated
statistical method (Bayesian nonlinear mixed effects beta regression), so ...
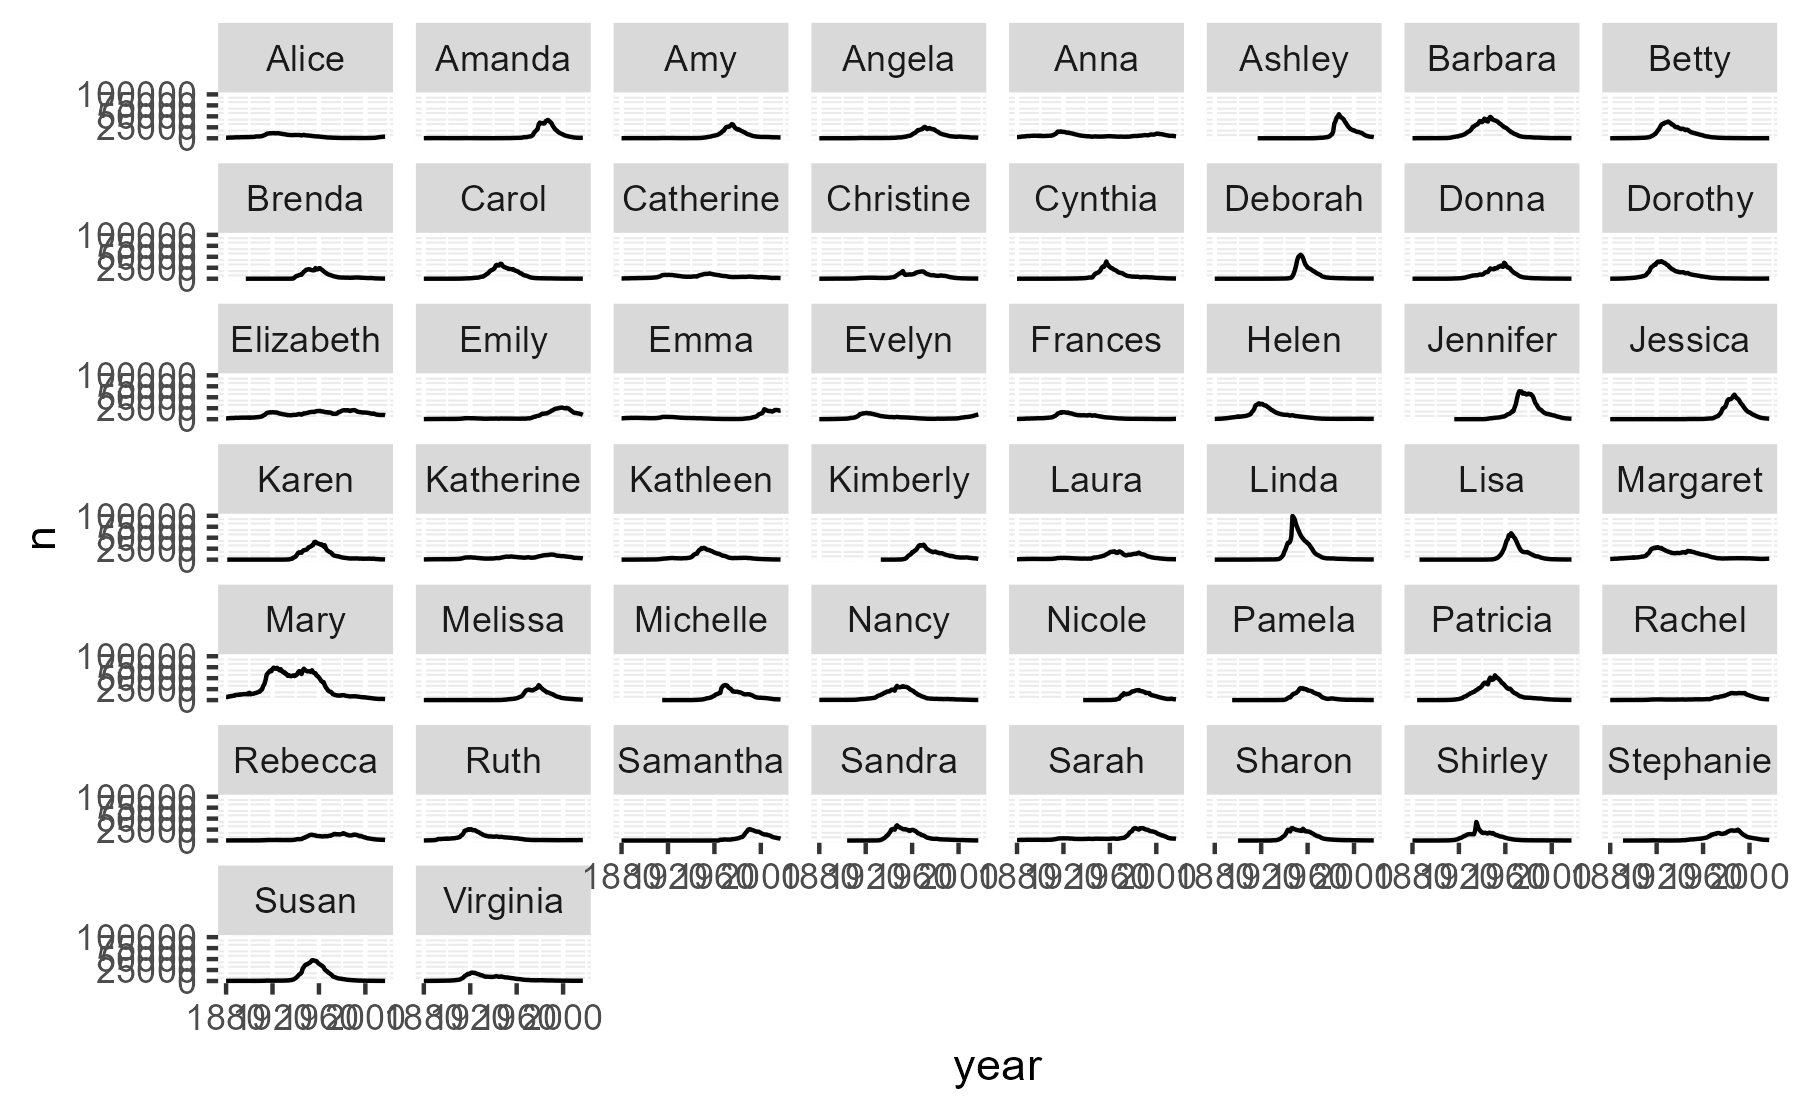
sample_n_of(): a useful helper function
Here’s the problem: I have some data with nested time series. Lots of them. It’s
like there’s many, many little datasets inside my data. There are too many
groups to plot all of the time series at once, so I just want to preview a
handful of ...
10 PRINT mazes with ggplot2
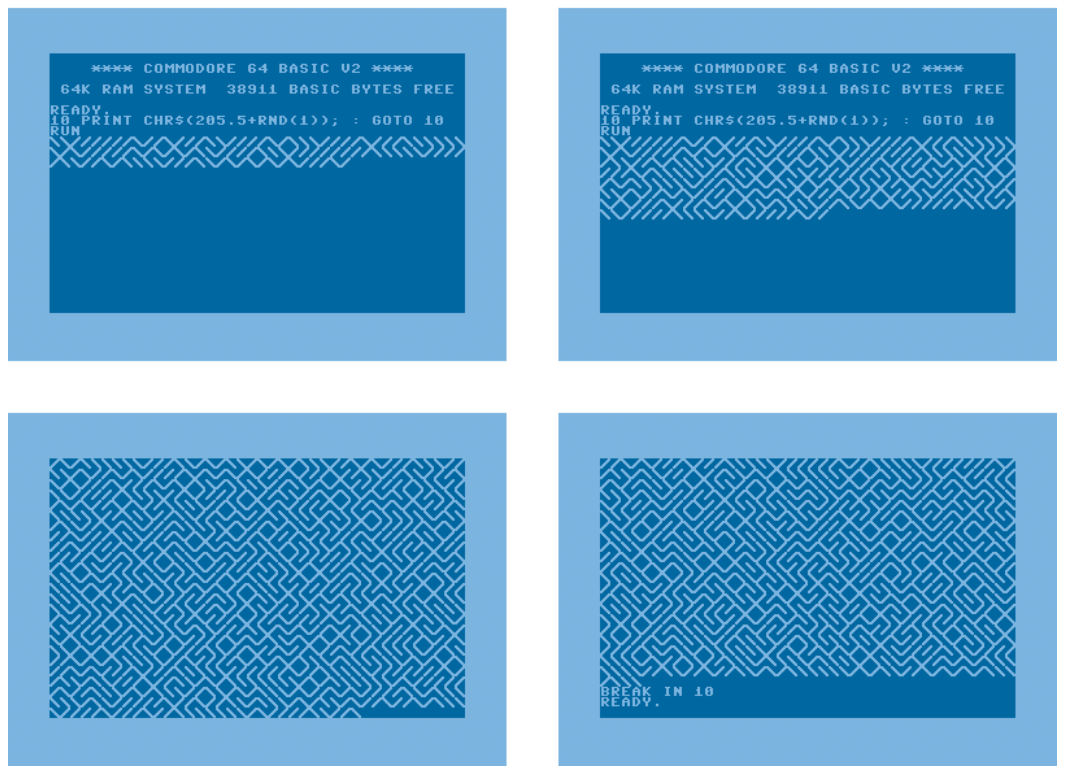
There is a celebrated Commodore 64 program that randomly prints outs / and \
characters and fills the screen with neat-looking maze designs. It is just one
line of code, but there is a whole book written about
it.
10 PRINT CHR$(205.5+RND(1)); : GOTO 10Screenshots of the 10 PRINT program in action. Images taken from the 10 PRINT book. ...
Copyright © 2025 | MH Corporate basic by MH Themes