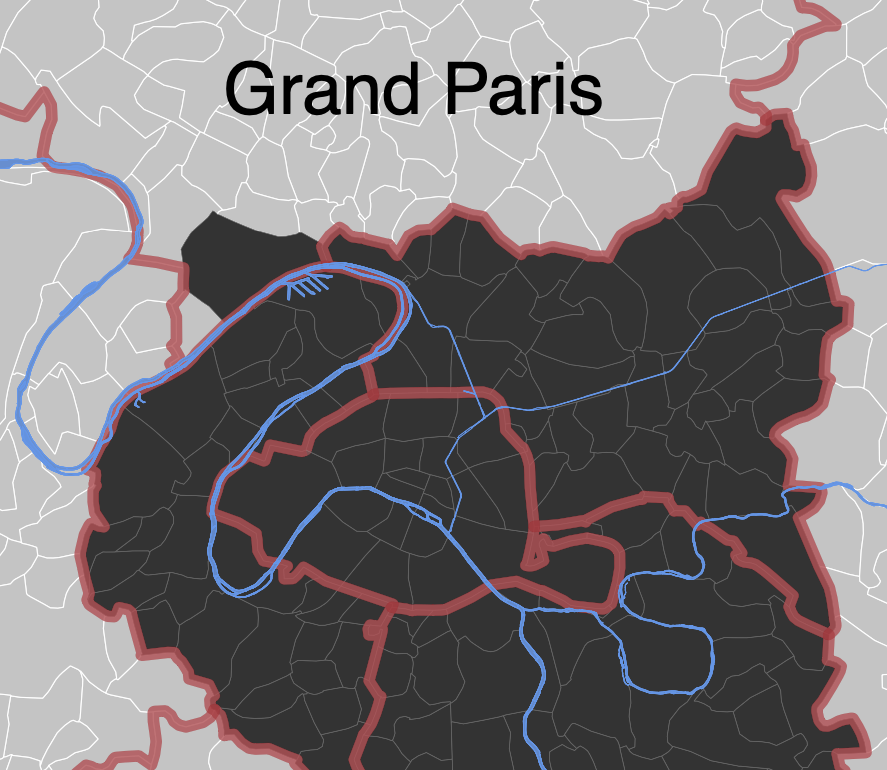
Trying to reproduce a map of the greater Paris area from APUR with ggplot2, a moment for coloring
In 2016, APUR the Paris urbanism agency published a map that described new Greater Paris area, see here.
At this time I was interested to reproduce this map in R with official datas/shapefiles and ggplot2.
A moment for coloring.
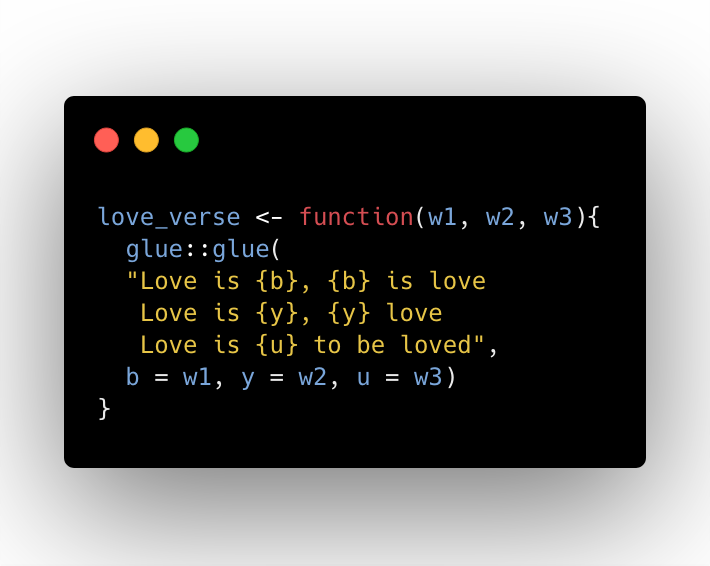
I put this code ...