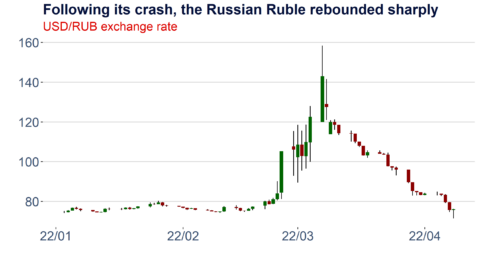
Linking R and Python to retrieve financial data and plot a candlestick
Are you interested in guest posting? Publish at DataScience+ via your RStudio editor.CategoryData ManagementTagsFinanceggplot2investpyR ProgrammingVisualizationI am way more experienced with R than with Python and prefer to code in this language when possible. This applies, especially when it is about visualizations. Plotly and ggplot2 are fantastic packages that ...