Articles by Dr. Jack Davis

Package Spotlight: anim.plots

May 28, 2019 | Dr. Jack Davis

The package anim.plots behaves like a sort of user-friendly shell on top of animate that makes animations of some of the most common types of plots in base R in a more intuitive fashion that animate. This package depends on two other important packages: -   magick, which is an ... [Read more...]

Natural Language Processing in R: Edit Distance

April 9, 2019 | Dr. Jack Davis

These are the notes for the second lecture in the unit on text processing. Some useful ideas like exact string matching and the definitions of characters and strings are covered in the notes of Natural Language Processing in R: Strings and Regular Expressions Edit distance, also called Levenshtein distance, is ...
[Read more...]

Writing R documentation, simplified

April 7, 2019 | Dr. Jack Davis

A massive part of statistical software development is the documentation. Good documentation is more than just a help file, it serves as commentary on how the software works, includes use cases, and cites any relevant sources. One cool thing about R documentation is that it uses a system that allows ...
[Read more...]

Bingo analysis, a tutorial in R

April 1, 2019 | Dr. Jack Davis

I'm toying with the idea of writing a book about statistical analyses of classic games. The target audience would be mathematically interested laypeople, much like Jeffrey Rosenthal's book Struck by Lightning ( https://www.amazon.ca/Struck-Lightning-Jeffrey-S-Rosenthal/dp/0006394957 ). The twist would be that chapter would contain step-by-step R code or Python ...
[Read more...]

Dataset – The Giant Marmots of Moscow

March 26, 2019 | Dr. Jack Davis

Stat 403/640/890 Analysis Assignment 3: Polluted Giant Marmots Due Wednesday, April 3rd Drop off in the dropbox by the stats workshop, or hand in in class. For this assignment, use the Marmots_Real.csv dataset. Main goal: The giant marmots of Moscow have a pollution problem. Find a model to predict the ... [Read more...]

Parameter Estimation of Binned Data

October 31, 2018 | Dr. Jack Davis

Section 1: Introduction – The Problem of Binned Data Hypothetically, say you’re given data like this in Table 1 below, and you’re asked to find the mean: Group Frequency 0 to 25 114 25 to 50 76 50 to 75 58 75 to 100 51 100 to 250 140 250 to 500 107 500 to 1000 77 1000 to 5000 124 5000 or more 42 Table 1: Example Binned Data.Border cases go to the lower bin. The ...
[Read more...]

Analyzing Jeopardy in R – Part 2

May 25, 2018 | Dr. Jack Davis

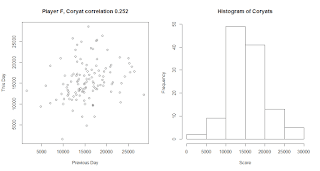
My previous Jeopardy analyzer was built using a base of about 30 daily Coryat scores. This one has more than 1600 scores that were either recorded directly, e-mailed to me, or scraped from the forum at jboard.tv . Here we look at the consistency of tou...
[Read more...]

Never miss an update!
Subscribe to R-bloggers to receive
e-mails with the latest R posts.
(You will not see this message again.)

Click here to close (This popup will not appear again)