Articles by Daniel

Study of a Plot: The Manhattan Plot

December 2, 2014 | Daniel

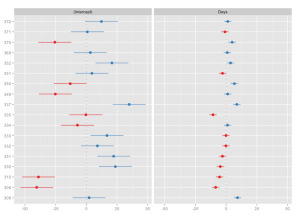
I was thinking on a nice way of plotting campaign expenditures in a paper I’m working on. I thought this would be something like the following, simple, but meaningful even in the context of lots of outliers in both tails. Although I like the seniors Tukey’s boxplot and ...
[Read more...]

Visualize pre-post comparison of intervention #rstats

August 19, 2014 | Daniel

My sjPlot-package was just updated on CRAN, introducing a new function called sjp.emm.int to plot estimated marginal means (least-squares means) of linear models with interaction terms. Or: plotting adjusted means of an ANCOVA. The idea to this function came up when we wanted to analyze the effect of ... [Read more...]

sjPlot 1.3 available #rstats #sjPlot

March 27, 2014 | Daniel

I just submitted my package update (version 1.3) to CRAN. The download is already available (currently source, binaries follow). While the last two updates included new functions for table outputs (see here and here for details on these functions), the current update only provides small helper functions as new functions. The ... [Read more...]

Developer snapshots of #sjPlot-package now on #Github #rstats

March 8, 2014 | Daniel

Finally, I managed to setup a GitHub repository. From now on, the latest developer snapshot of my sjPlot-package will be published right here: https://github.com/sjPlot/devel. Please post issues there, download the latest developer build for testing purposes or help developing the wiki-page with examples for package usage ... [Read more...]

Beautiful table outputs in R, part 2 #rstats #sjPlot

March 4, 2014 | Daniel

First of all, I’d like to thank my readers for the lots of feedback on my last post on beautiful outputs in R. I tried to consider all suggestions, updated the existing table-output-functions and added some new ones, which will be described in this post. The updated package is ... [Read more...]

Simply creating various scatter plots with ggplot #rstats

February 28, 2014 | Daniel

Inspired by these two postings, I thought about including a function in my package for simply creating scatter plots. In my package, there’s a function called sjp.scatter for creating scatter plots. To reproduce these examples, first load the package and then attach the sample data set: The simplest ... [Read more...]

No need for SPSS – beautiful output in R #rstats

February 20, 2014 | Daniel

About one year ago, I seriously started migrating from SPSS to R. Though I’m still using SPSS (because I have to in some situations), I’m quite comfortable and happy with R now and learnt a lot in the past months. But since SPSS is still very wide spread ... [Read more...]

Exponential Numbers

February 3, 2014 | Daniel

I received a message asking me why I use so often numbers like 1e6 (exponential form) instead of writing down the whole numbers. I never thought on this before. However, I can assure that it's not because I'm lazy and don't like typing long numbers. In fact, thinking on this ... [Read more...]

Comparing multiple (g)lm in one graph #rstats

January 29, 2014 | Daniel

It’s been a while since a user of my plotting-functions asked whether it would be possible to compare multiple (generalized) linear models in one graph (see comment). While it is already possible to compare multiple models as table output, I now managed to build a function that plots several (... [Read more...]

Finding out repeated variables in multiple datasets

January 28, 2014 | Daniel

Few days ago I posted on doing a smart job on importing several data files alike from a directory. Today, I want to return to this topic, but stretching it a bit further by adding some complexity. I want to have a snapshot of the datasets even before starting work ... [Read more...]

sjPlot 0.9 (data visualization package) now on CRAN #rstats

January 9, 2014 | Daniel

Since version 0.8, my package for data visualization using ggplot has been released on the Comprehensive R Archive Network (CRAN), which means you can simply install the package with install.packages("sjPlot"). Last week, version 0.9 was released. Binaries are already available for OS X and Windows, and source code for Linux. ... [Read more...]

R vs Stata: Importing and Saving Datasets

January 6, 2014 | Daniel

Today, I got a license of the new Stata/MP 13 (dual core), so I decided to make some succinct comparisons with R (Rstudio). Much more tests will come in the following weeks, but today I focused only on the basics: processing text files. Essentially, reading and writing raw datasets. The ... [Read more...]

sjPlotting functions now as package available #rstats

November 11, 2013 | Daniel

This weekend I had some time to deal with package building in R. After some struggling, I now managed to setup RStudio, Roxygen and MikTex properly so I can compile my collection of R-scripts into a package that even succeeds the package check. Downloads (package and manual) as well as ... [Read more...]
1 2 3 4 5

Never miss an update!
Subscribe to R-bloggers to receive
e-mails with the latest R posts.
(You will not see this message again.)

Click here to close (This popup will not appear again)