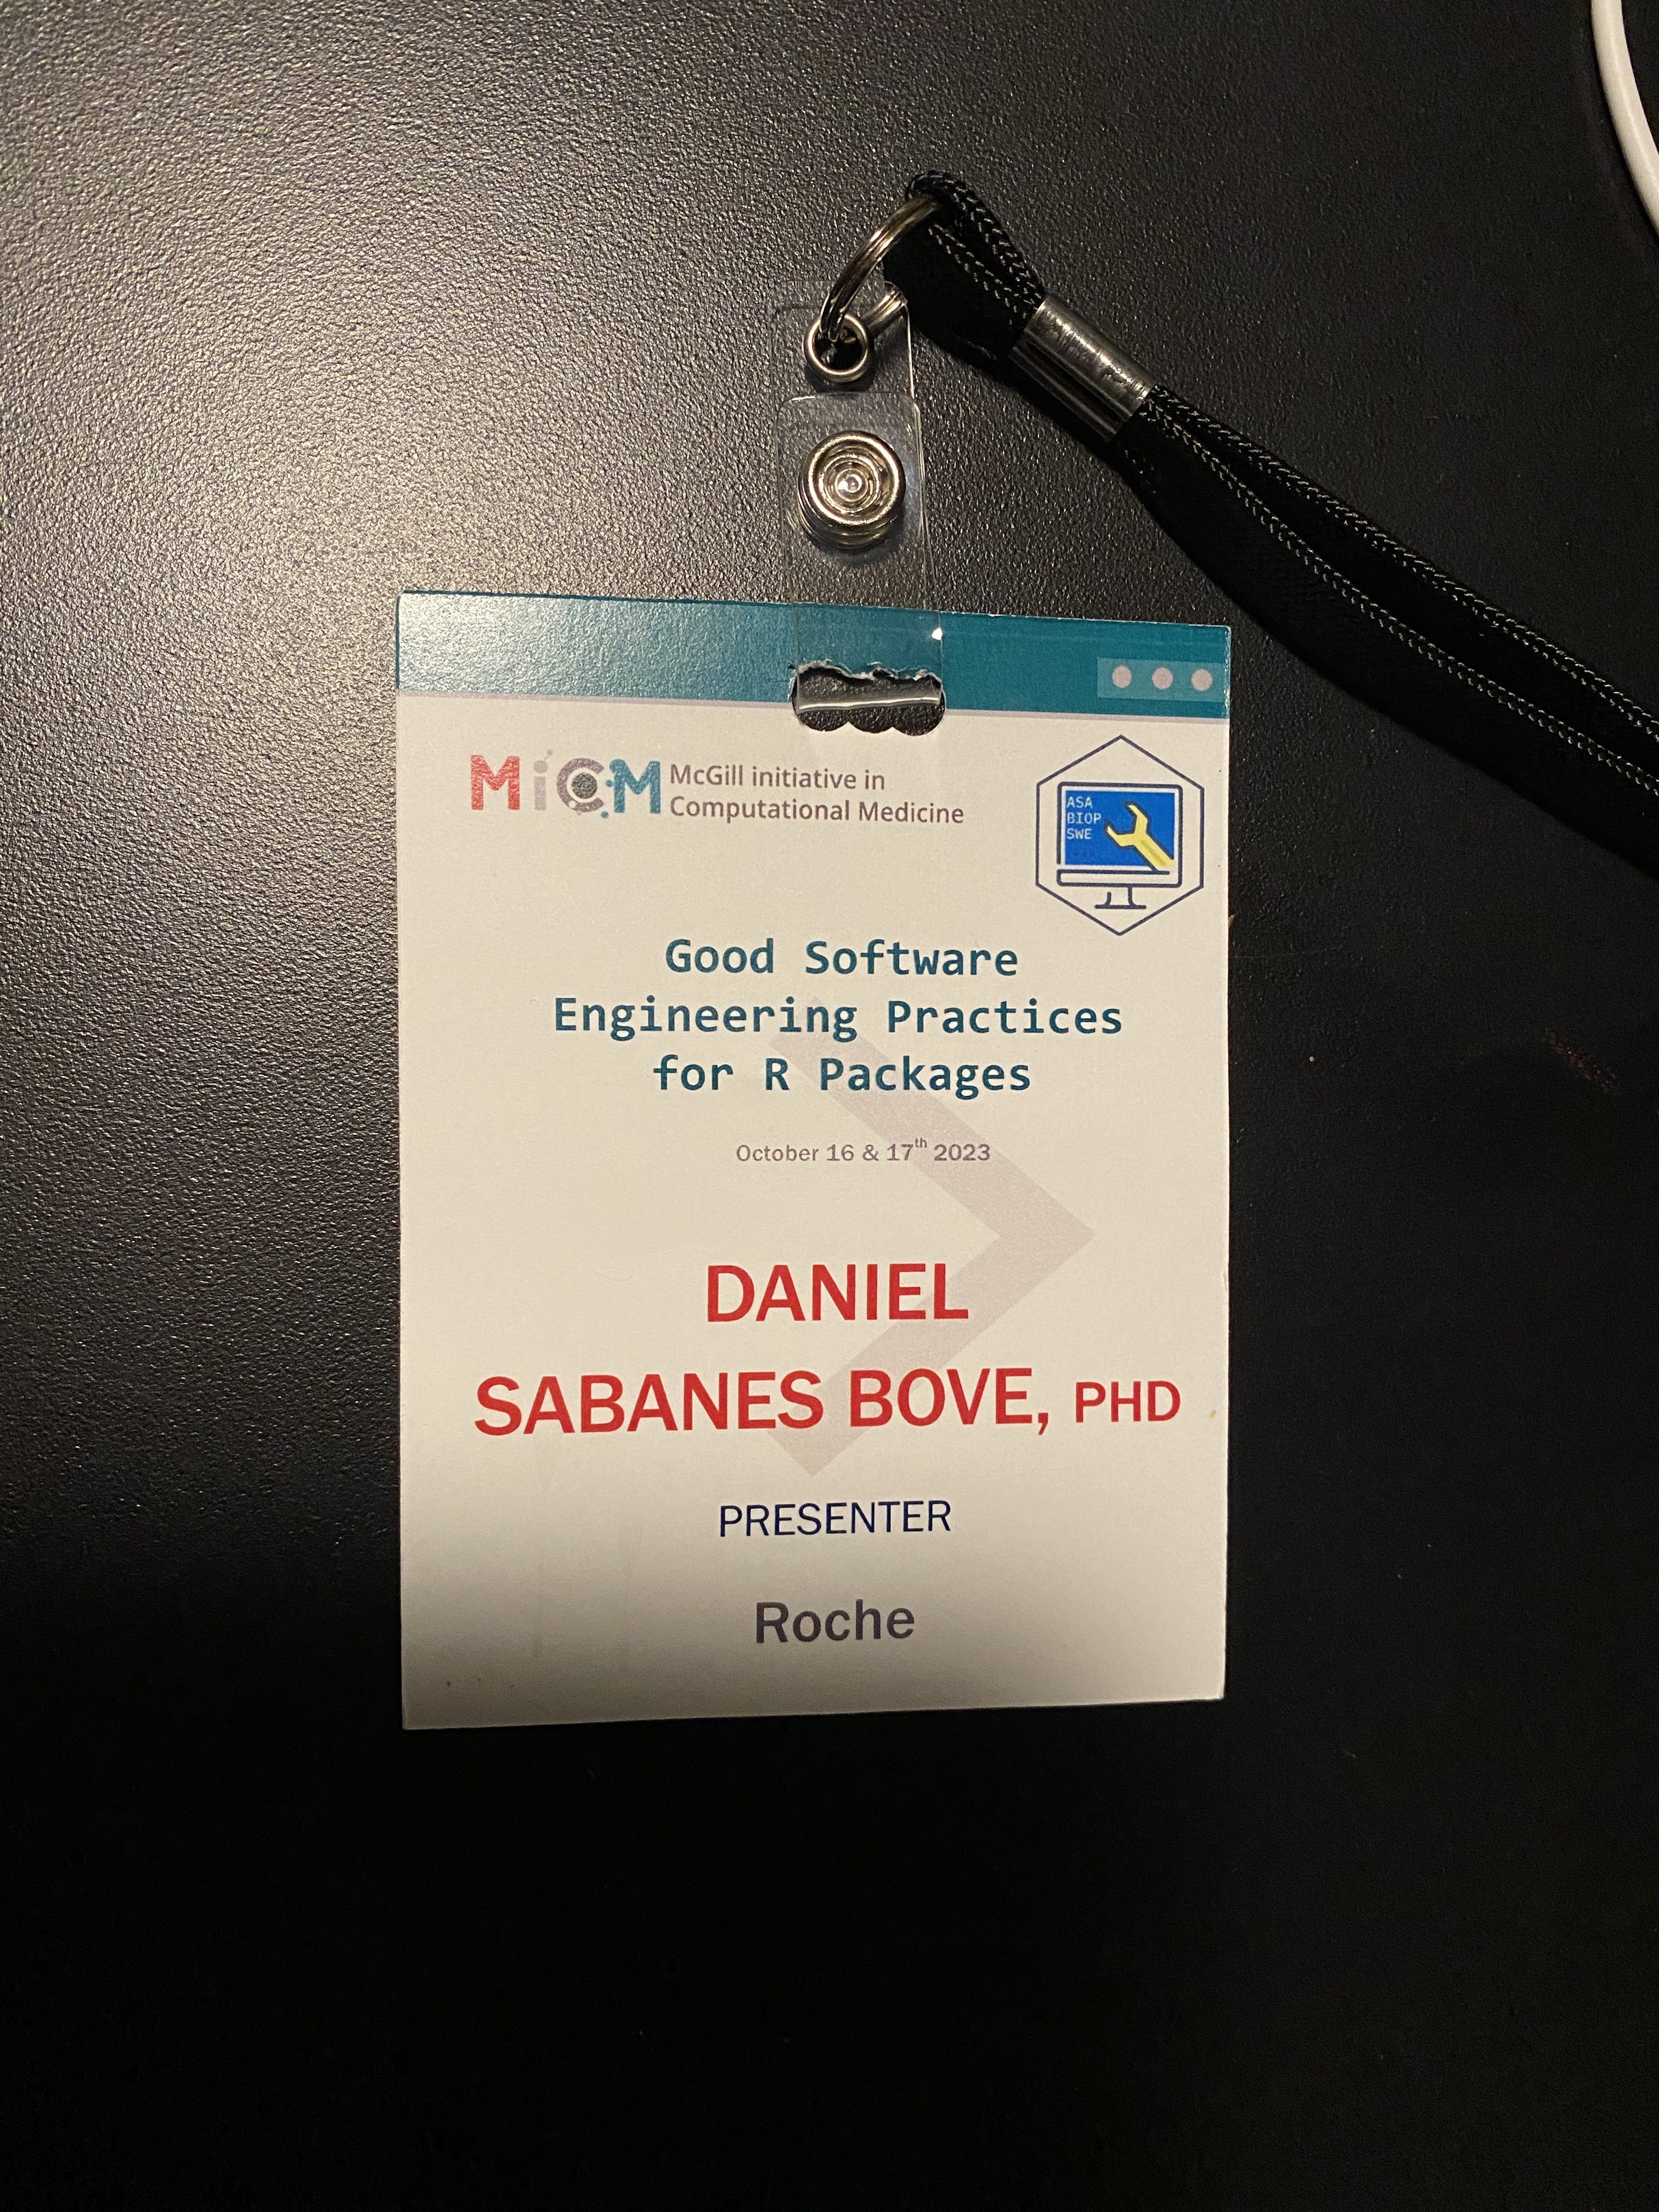
Celebrating 5 workshops on good SWE practices in 2023
Montreal workshop
On Monday and Tuesday this week (16 and 17 October), Doug Kelkhoff (Roche), Phil Boileau (Analysis Group) and Daniel Sabanés Bové (Roche) held another edition of the Good Software Engineering Practices for R Packages (or short...