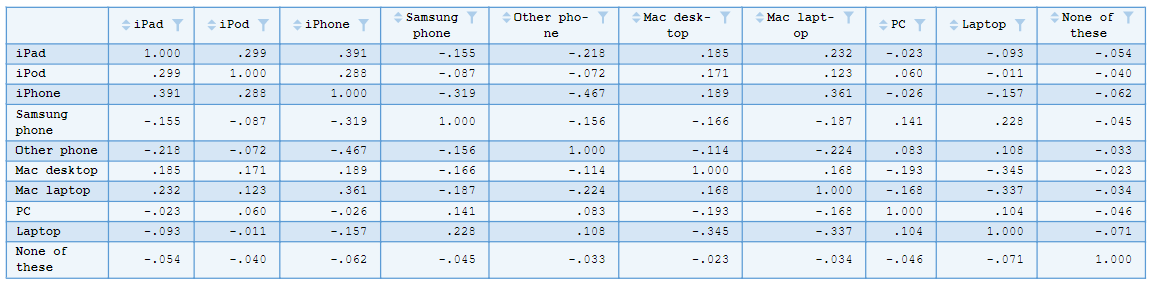
A correlation matrix is a table of correlation coefficients for a set of variables used to determine if a relationship exists between the variables. The...
To measure the overlap or similarity between the data in two binary variables you can use a Jaccard coefficient. The coefficient ranges between 0 and 1,...
In this article I will scrape a data table from a Wikipedia article. The data contains information about life expectancy for different groups within each...
You can use R to to splice and dice tables that have been created with Displayr’s built-in statistical engine. This is particularly handy when you want...
This post discusses a number of options that are available in R for analyzing data from max-diff experiments, using the package flipMaxDiff. For a more detailed explanation of how to analyze max-diff, and what the outputs...
I have previously written about some of the text analysis options that are available in Displayr: sentiment analysis, text cleaning, and the predictive tree. As text analysis is a growing field, you likely want to... [Read more...]