Hyperparameter Tuning Forecasts in Parallel with Modeltime
Speed up forecasting with modeltime’s new built-in parallel processing.
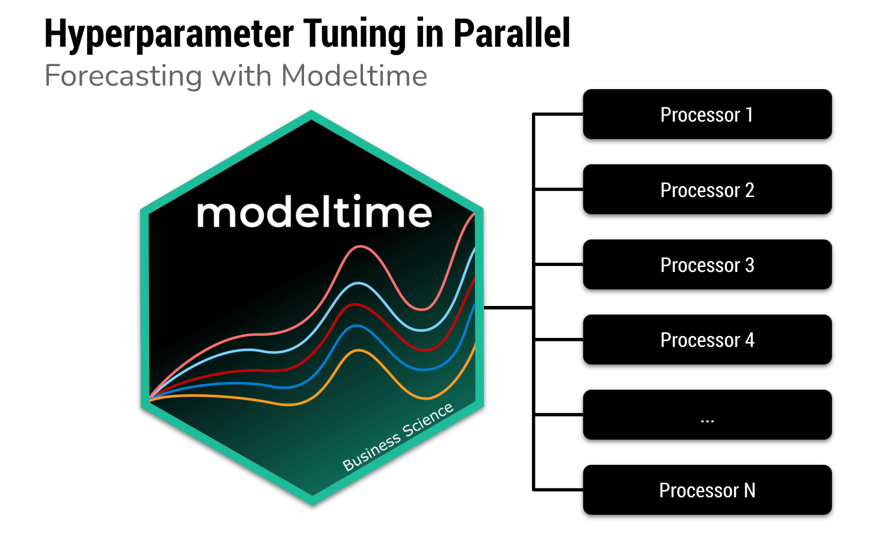
Fitting many time series models can be an expensive process. To help speed up computation, modeltime now includes parallel processing, which is support for high-performance computing by spreading the model fitting steps across multiple CPUs or clusters.
Highlights
We now ...