Connecting the dots… a quick primer on cubic splines
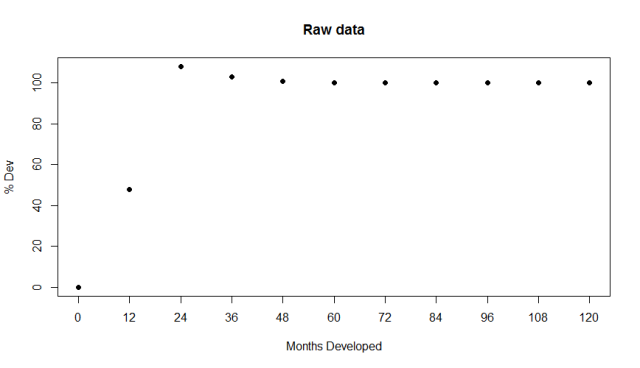
Recently I have been working with some insurance data, which was created in a forecast process that naturally throws out year-on-year snapshots (what I have), whereas I wanted to determine intra-year positions (what I need). Context The chart below show … Continue reading →