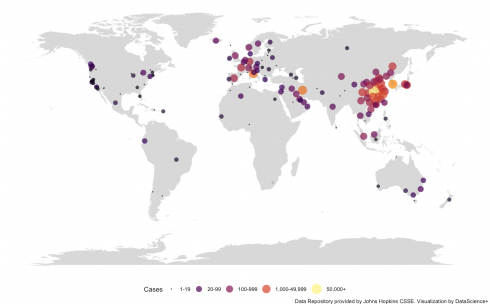
Map Visualization of COVID-19 Across the World with R
Are you interested in guest posting? Publish at DataScience+ via your RStudio editor.
Category
Visualizing Data
Tags
Data Visualisation
ggplot2
R Programming
Tips & Tricks
As you may all know, a new virus named a coronavirus (COVID-19) is affecting a lot of people all over the world. The symptoms are ranging ...