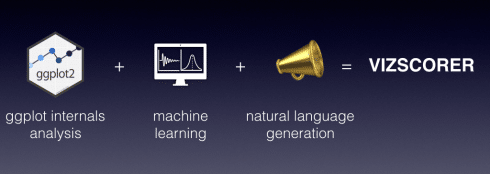
Introducing vizscorer: a bot advisor to score and improve your ggplot plots
CategoriesVisualizing Data
Tags
Data Visualisation
ggplot2
R Programming
One of the most frustrating issues I face in my professional life is the plentitude of ineffective reports generated within my company. Wherever I look around me is plenty of junk charts, like barplot showing useless 3D effects or ambiguous and crowded ...