Articles by Albert Rapp

Getting started with SQL with R

October 4, 2024 | Albert Rapp

In today’s blog post, I’m showing you how to work with databases from within R. As always, you can find the video version of this blog post on YouTube: Establish a connection Let us start by setting up a database connection. library(odbc) lib... [Read more...]

Creating interactive tables with reactable

August 17, 2024 | Albert Rapp

The R programming language has a rich ecosystem of packages that are fantastic for creating beautiful production-grade tables from within R. Today, I’m showing you that one package that makes it really easy (mostly) to create interactive tables. Namely, I’m going to show you {reactable}. 🥳 If you want ... [Read more...]

Calendar Plots With ggplot2

August 3, 2024 | Albert Rapp

library(tidyverse) ## ── Attaching core tidyverse packages ──────────────────────── tidyverse 2.0.0 ── ## ✔ dplyr 1.1.4 ✔ readr 2.1.5 ## ✔ forcats 1.0.0 ✔ stringr 1.5.1 ## ✔ ggplot2 3.5.1 ✔ tibble 3.2.1 ## ✔ lubridate 1.9.3 ✔ tidyr 1.3.1 ## ✔ purrr 1.0.2 ## ── Conflicts ────────────────────────────────────────── tidyverse_conflicts() ── ## ✖ dplyr::filter() masks stats::filter() ## ✖ dplyr::lag() masks stats::lag() ## ℹ Use the conflicted package () to force all conflicts to become errors library(reactable) counts filter(!is.na(sex)) |__ dplyr::count(species, ... [Read more...]

Text Styling With ggplot2

July 20, 2024 | Albert Rapp

In today’s blog post, we are figuring out how to fully control the text styling of the texts that we put into our ggplots. This means that we will learn how to dynamically adjust the text color depending on the background color, and how to use ...
[Read more...]

How to avoid empty line charts

June 29, 2024 | Albert Rapp

Have you ever tried to create a line chart with ggplot only to find that the chart remains blank and a warning showing up that each group consists out of one observation? That’s a common struggle and I used to attempt a lot of trial and error to...
[Read more...]

Master Data Cleaning & Get To Insights Faster

June 17, 2024 | Albert Rapp

Guten Tag! 👋 As data scientists we are judged by how quickly we can generate meaningful insights. But we’re often stuck with cleaning our data first. That’s bad. So that’s why I’m super excited to tell you that my new “Data Cleaning with R Master... [Read more...]

Why you shouldn’t use boxplots

June 8, 2024 | Albert Rapp

Box plots are a very common tool in data visualization to show how your data is distributed. But they have a crucial flaw. Let’s find out what that flaw is. And if you’re interested in the video version of this blog post, you can find it here: ...
[Read more...]

RStudio Shortcuts and Settings

June 1, 2024 | Albert Rapp

RStudio is the premier way to write R code. It is very user-friendly as it’s super easy to set up. But it also has a lot of pretty advanced features. In today’s blog post I’ll give you a list of my favorite RStudio tricks and shortcuts. If ... [Read more...]

Three Ways to Include Images in Your ggplots

May 18, 2024 | Albert Rapp

library(tidyverse) library(giscoR) library(ggiraph) germany_districts as_tibble() |__ janitor::clean_names() germany_states as_tibble() |__ janitor::clean_names() ggplt ggplot(aes(geometry = geometry)) + geom_sf( data = germany_states, aes(fill = nuts_name), color = 'black', linewidth = 0.5 ) + geom_sf_interactive( fill = NA, aes( data_id = nuts_id, tooltip = glue::glue(... [Read more...]

Create engaging tables with R or Python using {gt}

April 27, 2024 | Albert Rapp

The {gt} package is a beloved package in R that allows users to create engaging tables. This package does so through a structured and easy to learn syntax. And the cool thing is that {gt} and its excellent syntax for creating tables is now available for Python too under the ...
[Read more...]

WebDev4R: Understanding Quarto Notation

April 10, 2024 | Albert Rapp

Quarto is a great tool to create all kinds of documents from the same source code. But it’s notation can sometimes feel random and confusing. For example, if you’ve ever wondered why you had to use ::: {.panel-tabset} ## Panel 1 ## Panel 2 ::... [Read more...]

WebDev4R: CSS Grid

April 3, 2024 | Albert Rapp

There are two major systems to align things in CSS. These are flexbox and grid layout. Both of them are really useful to know to have any chance to make nice websites or app. And today we’re going to focus on flexbox. And as always, if you want to ... [Read more...]

Creating upset charts with ggplot2

March 23, 2024 | Albert Rapp

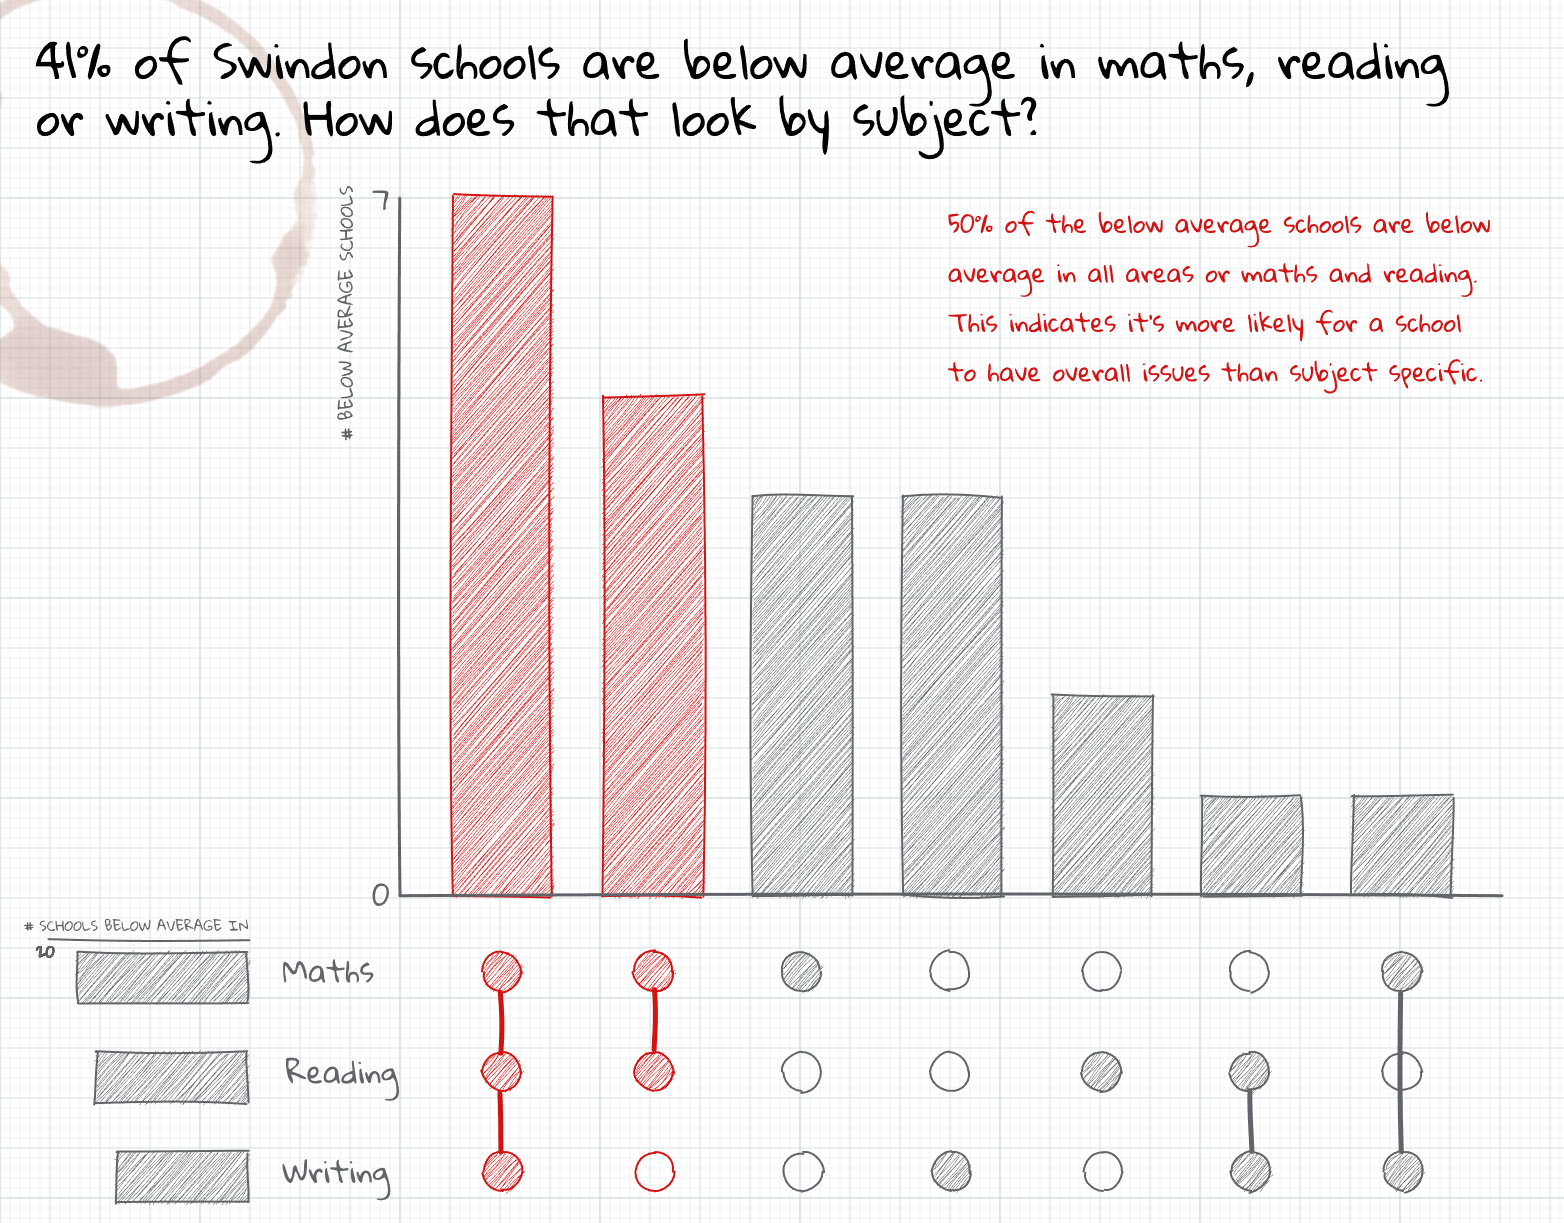
I recently saw this cool chart on a Storytelling with data community post. It shows you how many schools are below average in maths, reading, and writing. Notice that a school can be below average in more than one subject and the dots between th...
[Read more...]
1 2 3