

Want to share your content on R-bloggers? click here if you have a blog, or here if you don't.
Try out The Climate Impact Sorting Challenge! A quick game I just made that teaches you about the climate impact of different kinds of food.
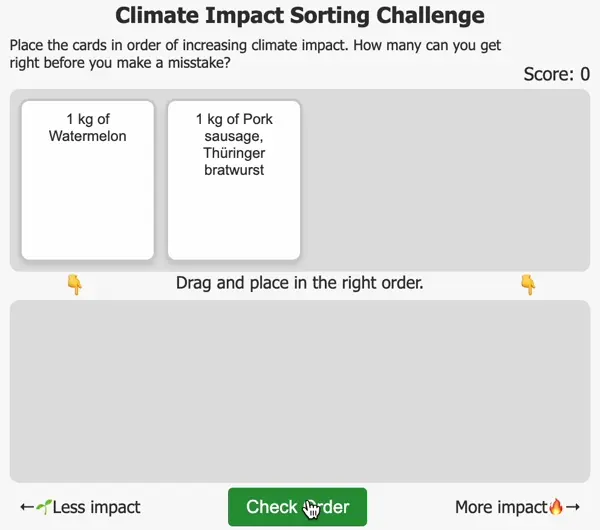

This game can be played in two different ways. You can play it by yourself and try to beat your own high score (mine is 9). If you’re in a group, you can play “last man standing” style, where you take turns placing the cards. When someone misplaces a card, that person is out! (Strategy tip: If it’s beef, it’s bad).
Q&A
Where is this data from? The emission factors data is from The Big Climate Database v1.2, specifically the Danish emission factors. I chose the Danish emission factors as they were the most complete, as this database is of Danish origin, but these emission factors will be roughly applicable to other European countries as well.
How was this made? This was put together mostly in a single day, mostly by me shouting at the computer until it did what I wanted (a.k.a. AI-driven development). I started out knowing I wanted to make a single HTML page app built on the SortableJS JavaScript library, which makes it easy to add drag-and-droppable lists to a webpage. Then, with some judicious prompting of the ChatGPT o1-preview model, I got a working game in ~1 hour. Here’s the full transcript of this initial prompting history. I then whipped up a small R script to parse and insert the emission factors from The Big Climate Database into the game, and with some final tweaks and fixes, that was basically it. The full code is available here on GitHub.
Any caveats? Yes, lots. Notably, these emission factors are averages, and the specific climate impact of any type of food can vary significantly depending on how the food is produced. Another thing to consider is that the emission factors are per kg of food. This does not take into account that different foods have different nutritional values. For example, a kg of butter has a much higher climate impact than a kg of lettuce, but a kg of butter also has a much higher energy content than a kg of lettuce.
R-bloggers.com offers daily e-mail updates about R news and tutorials about learning R and many other topics. Click here if you're looking to post or find an R/data-science job.
Want to share your content on R-bloggers? click here if you have a blog, or here if you don't.