
Want to share your content on R-bloggers? click here if you have a blog, or here if you don't.
This is reposted from the original at https://blog.stephenturner.us/p/python-for-r-users.
—
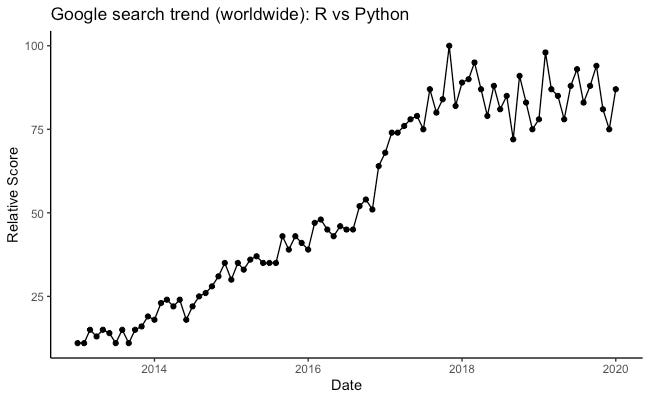
A Google search for “R vs Python” returns thousands of hits across sites like Reddit, IBM, Datacamp, Coursera, Kaggle, and many others. A quick Google Trends analysis shows that this search query has grown steadily over the last decade.
Any real data scientist would agree that this argument is silly, that the right answer is to use the best tool for the job. What’s “best” isn’t always easy to answer. Sometimes the “best tool” might be the one that you’re most familiar with and can write most easily. After all, compute time is cheap relative to software engineer time. In other cases there truly is a better choice depending on the problem (e.g., the AI ecosystem is generally more well developed in Python, while the Bioconductor ecosystem provides R with a rich framework for many kinds of bioinformatics tasks). I’m partial to R/tidyverse for tabular data analysis and manipulation, but if polars or pandas is your thing, that’s cool too.
Beyond “choose the right tool,” my biggest advice to trainees and students when asked about “R vs Python” was to learn both languages, but learn one of them so well as to be native-level fluent in the language. That is, become so comfortable in a language that you rarely have to look up documentation, where you have a natural intuition about how to best implement a variety of your everyday tasks, where you know how to write code, docs, and unit tests without really thinking about it.
R is that language for me. I can read, write, debug, and package code in Python, but it doesn’t come to me as easily. I’ve been collecting and bookmarking resources over the years that I’ve turned to for writing and reading Python, coming from native R fluency. LLMs have a new place in this as well, and I touch on that in the end.
For beginners: Learn Python with CS50
If you’re just getting started with Python or programming in general, there are thousands of courses and resources to help you get started. My favorite one to recommend is David Malan’s CS50 course at Harvard. The course materials are here, and the entire 16-hour course is available on YouTube. I still revisit the OOP section from time to time. It likely covers concepts you already know well, as this is meant to be an introduction to programming, using Python.
https://www.youtube.com/watch?v=nLRL_NcnK-4
Learn X in Y minutes
learnxinyminutes.com has a collection of very short primers on different programming languages. These assume you’ve programmed in other languages before and understand flow control, OOP, functions, classes, etc. The Learn X in Y minutes where X=Python tour is here: learnxinyminutes.com/docs/python/. It’s a good place to start if you don’t need to learn what a for loop is or how flow control works. This is simply a long Python scripts with comments throughout that demonstrate main features of the language for programmers coming from another language.
Reticulate vignette: Python Primer for R Users
Reticulate is an R package that enables interoperability between R and Python. It allows you to call Python from R, translate between R and python objects, and create bindings to different Python virtual environments or Conda environments.
The Primer on Python for R Users vignette in the reticulate package is a great place to start if you’re a seasoned R user and want to know how to write Python code to do things in R that you’re familiar with. The primer covers data structures, iteration, indexing, function definition, classes, dunder methods, iterators, generators, imports and modules, decorators, and more.
Emily Riederer’s Python Rgonomics series
I’ve never personally met Emily but I’ve been following her since I saw her rstudio::global 2020 talk on building an R package ecosystem internal to your organization (video, slides, post). It’s a great talk whether you’re programming in R, Python, Rust, whatever, and building off of open-source tools packages for internal organization use only.
Emily recently published a three part series on Python ergonomics and patterns for seasoned R developers. Links to her posts with her description below.
Python Rgonomics: Switching languages is about switching mindsets – not just syntax. New developments in python data science toolings, like polars and seaborn’s object interface, can capture the ‘feel’ that converts from R/tidyverse love while opening the door to truly pythonic workflows.
polars’ Rgonomic Patterns: In this follow-up post to Python Rgonomics, we deep dive into some of the advanced data wrangling functionality in python’s
polarspackage to see how it’s powertools like column selectors and nested data structures mirror the best ofdplyrandtidyr’s expressive and concise syntaxBase Python Rgonomic Patterns: Getting comfortable in a new language is more than the packages you use. Syntactic sugar in base python increases the efficiency, and aesthetics of python code in ways that R users may enjoy in packages like
glueandpurrr. This post collects a miscellaneous grab bag of tools for wrangling, formatting (f-strings), repeating (list comprehensions), faking data, and saving objects (pickle).
Additionally, I wasn’t able to make it to posit::conf(2024) this year, but from a few colleagues who did, I heard her talk on the topic was great. The talks from the conference aren’t yet online, but Posit usually posts them to YouTube a few months after the conference. Description of her talk from the conference agenda:
Python Rgonomics
Data science languages are increasingly interoperable with advances like Arrow, Quarto, and Posit Connect. But data scientists are not. Learning the basic syntax of a new language is easy, but relearning the ergonomics that help us be hyperproductive is hard. In this talk, I will explore the influential ergonomics of R’s tidyverse. Next, I will recommend a curated stack that mirrors these ergonomics while also being genuinely truly pythonic. In particular, we will explore packages (polars, seaborn objects, greattables), frameworks (Shiny, Quarto), dev tools (pyenv, ruff, and pdm), and IDEs (VS Code extensions). The audience should leave feeling inspired to try python while benefiting from their current knowledge and expertise.
Python for Data Science translation of R4DS
Hadley, Mine, and Garrett’s book R for Data Science is a must-read for anyone looking to upskill their R chops for data analysis and visualization, and the second edition is available to read free online at r4ds.hadley.nz.
Arthur Turrell and others have written Python for Data Science (aeturrell.github.io/python4DS), heavily inspired by R4DS, with most of the chapters mirroring R4DS. The image below shows the TOCs from both books. The book mostly uses pandas and lets-plot (“ggplot2 for python”).

Shiny for Python
The Shiny for Python docs (shiny.posit.co/py/docs) are pretty good for getting into Shiny for Python, especially if you have some experience with Shiny for R.
If you’re looking for more of a hand-holding approach, I’d recommend Gordon Shotwell’s free Reactive Web Dashboards with Shiny Course available on Talk Python Training.
Get practice
You don’t get better at Python by reading about Python or watching videos about Python. There’s no lack of good resources for Python exercises. A few resources that I’ve found particularly useful are listed below.
Corey Schafer’s YouTube channel (youtube.com/@coreyms): This channel has playlists of short videos and tutorials on Pandas, Matplotlib, OOP, and many other short and long video walkthroughs I’ve found useful.
Python on Exercism (exercism.org/tracks/python): Lots of free exercises.
Practice Python (practicepython.org): More practice!
Automate the Boring Stuff with Python (automatetheboringstuff.com): A free online book with simple projects for automating boring tasks (renaming files, etc).
Advent of Code (adventofcode.com): An Advent calendar of small programming puzzles for a variety of skill sets and skill levels that can be solved in any programming language you like. It starts every year around the holidays, but you can go back and view old puzzles from previous years any time. These are fun for little friendly office competition as well.
ChatGPT and friends
Of all the advice in this post, this one is likely to get stale fastest, so I’ll keep it short. Use LLMs where you can! ChatGPT and other LLMs can essentially act as your pair programmer or personal StackOverflow helping you translate your R expertise into Python with contextualized explanations. You can ask ChatGPT for Python equivalents of familiar R functions, syntax comparisons, or specific code examples tailored to data manipulation, statistical analysis, or visualization. You can paste in Python code, ask what it’s doing, and see what equivalent R code would have been. Paste in error messages and your code and it’ll tell you what went wrong and how to change things. I imagine all the leading LLMs are better with Python than nearly any other programming language, so make use of these tools where you can!


R-bloggers.com offers daily e-mail updates about R news and tutorials about learning R and many other topics. Click here if you're looking to post or find an R/data-science job.
Want to share your content on R-bloggers? click here if you have a blog, or here if you don't.