
DuckDB vs dplyr vs base R
Want to share your content on R-bloggers? click here if you have a blog, or here if you don't.
Reposted from https://blog.stephenturner.us/p/duckdb-vs-dplyr-vs-base-r.
TL;DR: For a very simple analysis (means by group on 100M rows), duckdb was 125x faster than base R, and 28x faster than readr+dplyr, without having to read data from disk into memory. The duckplyr package wraps DuckDB’s analytical query processing techniques in a dplyr-compatible API. Learn more at duckdb.org/docs/api/r and duckplyr.tidyverse.org.
I wanted to see for myself what the fuss was about with DuckDB. DuckDB is an open-source, high-performance, in-process SQL query engine designed specifically for analytical tasks. Often referred to as the “sqlite for analytics” DuckDB is optimized for OLAP (Online Analytical Processing) workloads — data is organized by columns meaning that the database is optimized for fast reading and large, complex queries that involve filtering, aggregations, and joins. It’s “embedded” in the same sense that sqlite is — it has no external dependencies, no DBMS server to install, setup, and maintain. It doesn’t as a separate process — it runs embedded within a host process, conferring the advantage of high-speed data transfer to and from the database, or in some cases direct querying of the data without actually importing or copying any data at all. Read more at duckdb.org/why_duckdb.
DuckDB and R
DuckDB has an R API available (see docs). You can install the duckdb package from CRAN or GitHub. Why might you want to use DuckDB in R?
Large Datasets: When you have data too large for memory, DuckDB can efficiently query data from disk without needing the entire dataset in memory.
SQL-Like Queries: If you’re more comfortable with SQL, DuckDB allows you to run SQL queries directly on your R data frames. You can perform complex operations such as grouping, filtering, joining, and aggregating, using familiar SQL syntax. Again, without ever reading data into memory in R.
Efficient Analytical Queries: For workloads involving large aggregations or queries on millions of rows DuckDB can handle large analytical queries while minimizing memory overhead and keeping performance high.
Stay in R! Using DuckDB in R lets you use DuckDB for the heavy lifting analytical queries, giving you results back in a table that you can take forward for visualization or further analysis.
Benchmarking DuckDB Against dplyr and base R
I wanted to get a sense for myself how fast DuckDB might be compared to base R and dplyr. This will be a simple experiment: I’ll simulate some data and write out to disk, then I’ll use base R, dplyr, and duckdb to read in the data, group by a variable, and compute the means of two different columns. Simple. There are other, better benchmarks elsewhere (e.g., see posts here and here from Appsilon).
All the code below requires a few libraries loaded.
library(tidyverse)
library(DBI)
library(duckdb)
Simulating the data
The code below simulates 100 million rows and some random values and dates.
n <- 1e8
set.seed(42)
dat <-
  tibble(
    id = sample(1:1e7, n, replace = TRUE),
    category = sample(letters, n, replace = TRUE),
    value1 = rnorm(n),
    value2 = runif(n, min = 0, max = 1000),
    date = sample(seq.Date(from = as.Date("2010-01-01"),
                           to = as.Date("2020-12-31"),
                           by = "day"), n, replace = TRUE)) |>
  arrange(id, category, date)
dat |> write_csv("dat.csv")
The first 15 rows looks like this:
      id category value1 value2 date
   <dbl> <chr>     <dbl>  <dbl> <date>
 1     1 b        -1.26   145.  2020-02-15
 2     1 g        -0.316  157.  2020-06-03
 3     1 i        -1.42   919.  2019-11-24
 4     1 k         0.592  349.  2011-06-15
 5     1 l        -0.292  650.  2013-03-19
 6     1 m         0.316  802.  2015-05-25
 7     1 q         0.112  470.  2020-07-13
 8     1 t         0.637  236.  2011-02-26
 9     1 w         1.72    49.5 2016-02-25
10     2 a        -0.572  506.  2018-01-22
11     2 c        -0.608  440.  2018-10-13
12     2 c        -1.26   553.  2020-09-25
13     2 g         0.563  773.  2018-02-27
14     2 l         1.07   933.  2012-07-29
15     2 l        -0.163  363.  2017-10-07
Functions for processing data
The three functions below takes a file path, reads in the data1, computes the mean of value1 and value2 grouped by id, and returns a list of the summarized result and the time it took to run the analysis.
With base R:
process_base <- function(x) {
  time <- system.time({
    dat <- read.csv(x)
    res <- aggregate(cbind(value1, value2) ~ id, data = dat, FUN = mean)
    res <- res[order(res$id), ]
  })
  return(list(res=res, time=time))
}
With dplyr:
process_dplyr <- function(x) {
  time <- system.time({
    dat <- read_csv(x, show_col_types=FALSE, progress=FALSE)
    res <- dat %>%
      group_by(id) %>%
      summarise(
        mean_value1 = mean(value1),
        mean_value2 = mean(value2)
      )
  })
  return(list(res=res, time=time))
}
With duckdb (see below for a friendlier way to write this with duckplyr):
process_duckdb <- function(x) {
  time <- system.time({
    conn <- dbConnect(duckdb())
    res <-
      dbGetQuery(conn = conn,
                 statement=glue::glue("
                     SELECT id,
                      AVG(value1) as mean_value1,
                      AVG(value2) as mean_value2
                     FROM read_csv('{x}', parallel=true)
                     GROUP BY id
                     ORDER BY id"))
  })
  dbDisconnect(conn, shutdown=TRUE)
  return(list(res=res, time=time))
}
Results
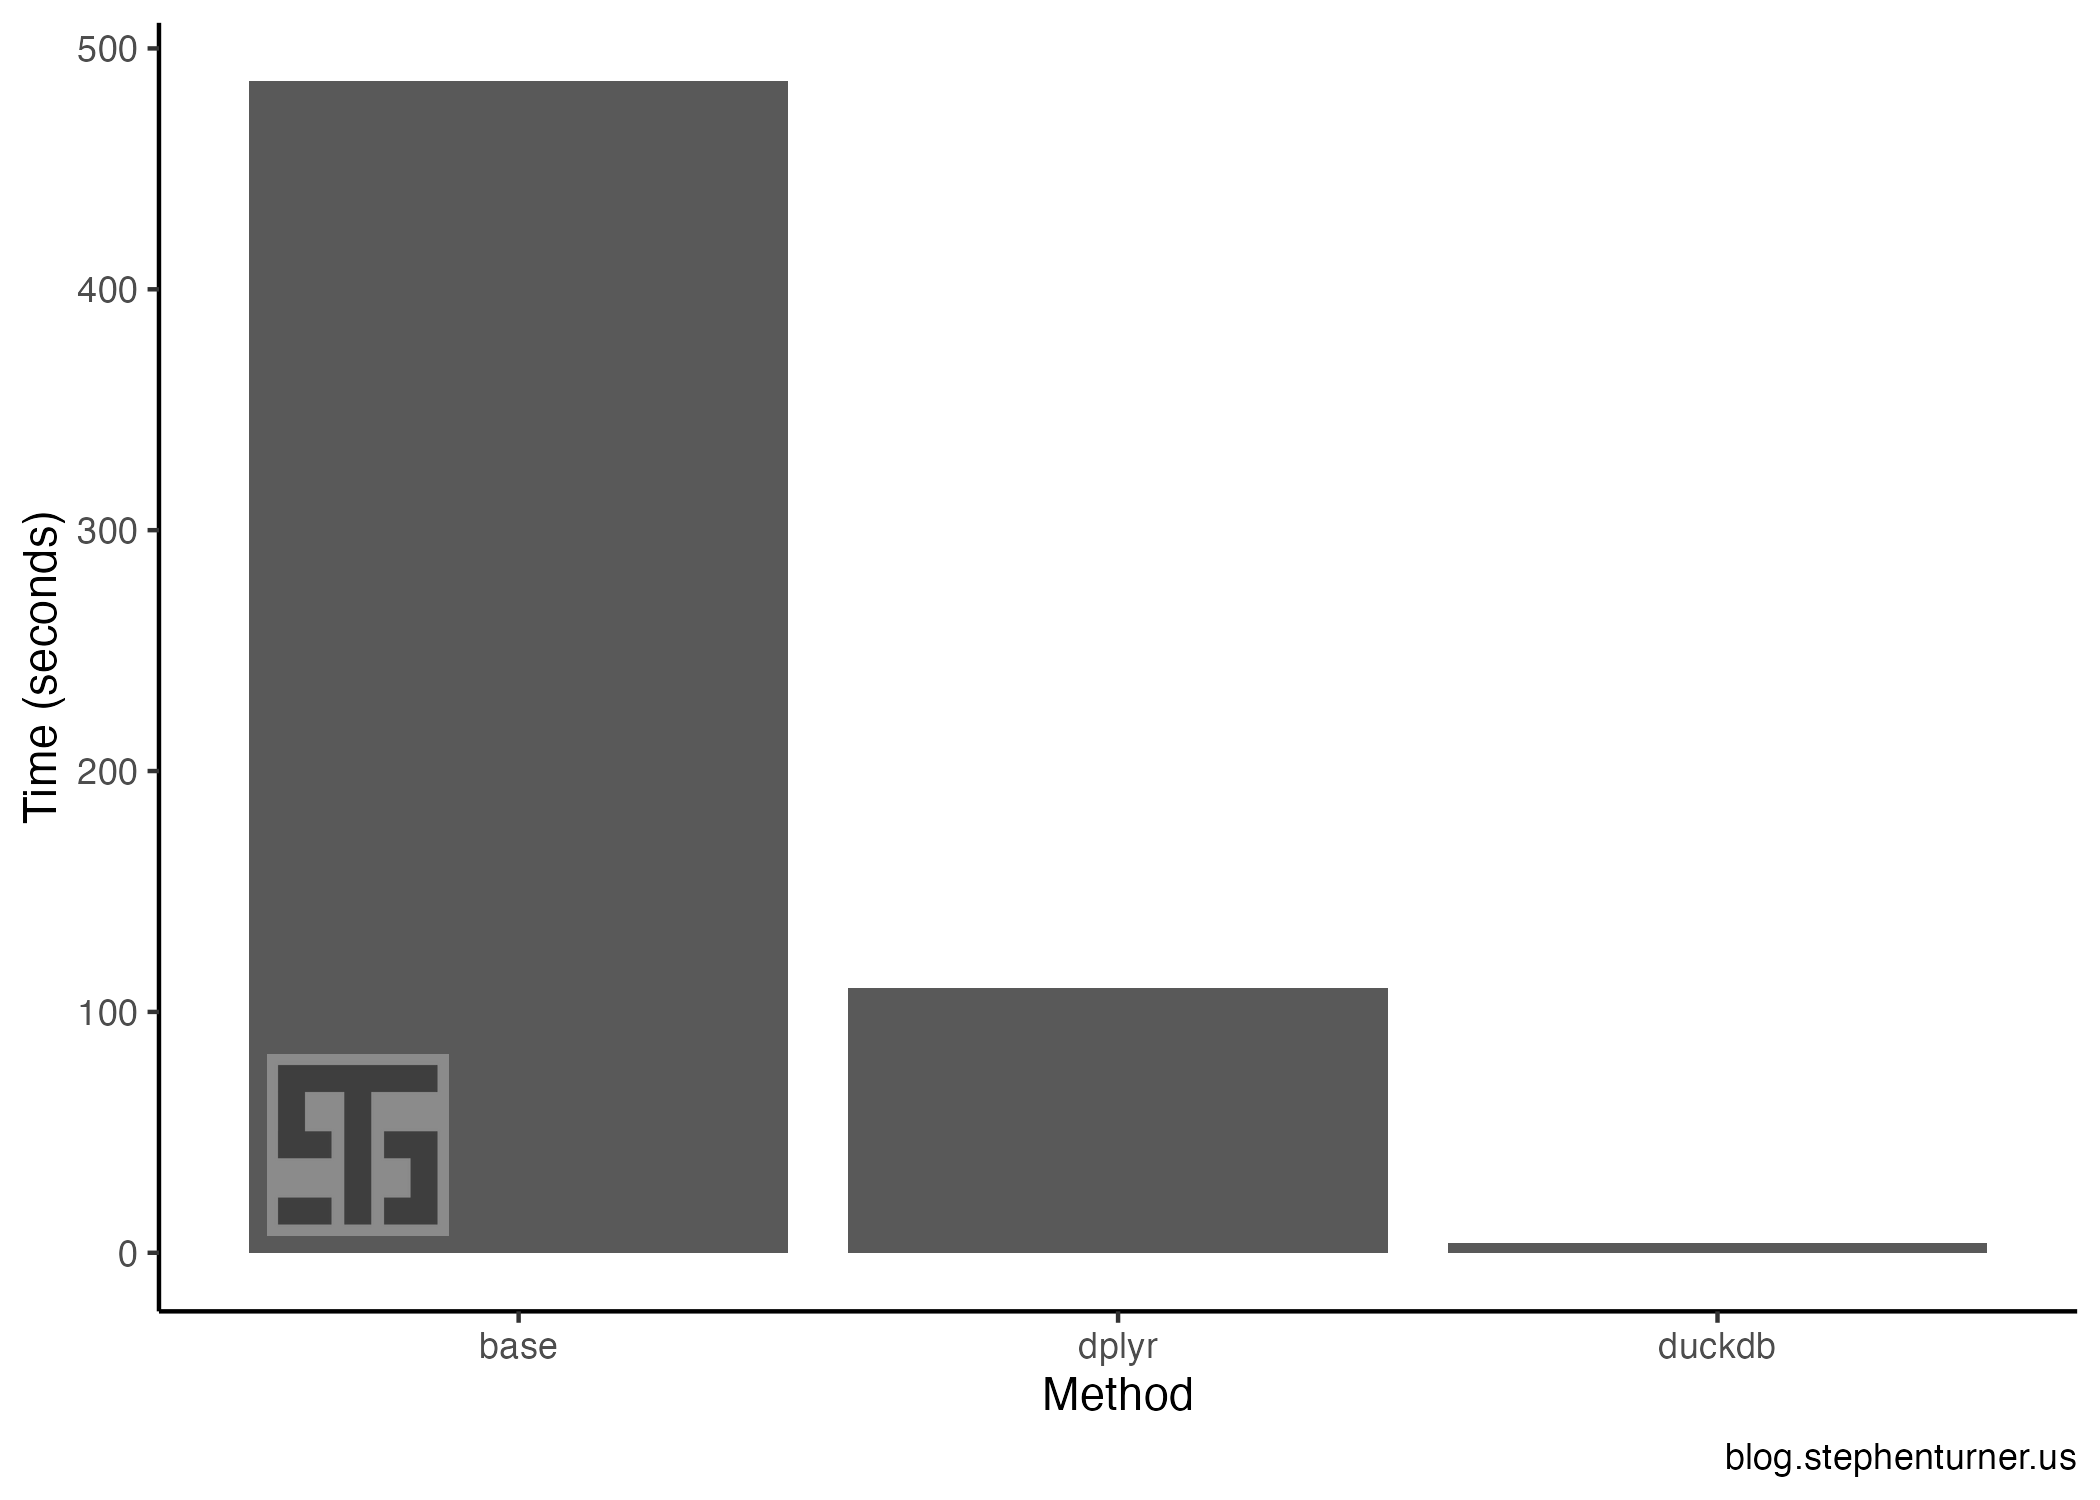
The results were striking, shown below. Using duckdb was 125x faster than base R, and 28x faster than readr+dplyr.
duckdb: 3.86 seconds
dplyr: 110 seconds
base: 486 seconds
duckplyr
The DBI + dbConnect() + dbGetQuery() with plain SQL above isn’t the most ergonomic or idiomatic R way to read and analyze data in R. Good news: the duckplyr package for R wraps DuckDB's analytical query processing techniques in a dplyr-compatible API. Learn more about it at duckplyr.tidyverse.org.
Here I’m using the duckplyr_df_from_file() function to “read in” the data from a file, while the summarize and arrange methods are overwriting the functions from dplyr with the duckplyr version. This operation also takes ~3 seconds, and is much easier to read with the familiar dplyr tools you’re used to. Take a look at DuckDB’s blog post on duckplyr to really understand how this works.
library(tidyverse)
library(duckplyr)
res <-
  duckplyr_df_from_file("dat.csv", table_function="read_csv") |>
  summarize(
    mean_value1 = mean(value1),
    mean_value2 = mean(value2),
    .by=id) |>
  arrange(id)
res
Learning more
I recently wrote a short essay on Learning in Public. Something I’m trying to do more of.

The “benchmark” here was a simple and limited one, and I mostly used it as an excuse for me to learn a little about duckdb and how to integrate it into my workflow. In this benchmark I didn’t attempt to separate time spent reading data into memory versus time spent processing, and the “analysis” was a simple mean by group. I didn’t attempt to parallelize or optimize either the base R or dplyr approaches, and I didn’t do anything with data.table.
For more extensive benchmarks I’d recommend reading through a few of Appsilon’s recent posts on using duckdb in R, for huge data, and with Shiny:
There are also a few talks from last year’s posit::conf(2023) on using R with duckdb. Those talks are available on YouTube.
Finally, Hannes Mühleisen (CEO, DuckDB Labs) gave a keynote at this year’s posit::conf(2024): Data Wrangling [for Python or R] Like a Boss With DuckDB. The talks from this year’s conference aren’t out yet. The talk’s abstract from the conference agenda is below.
Data wrangling is the thorny hedge that higher powers have placed in front of the enjoyable task of actually analyzing or visualizing data. Common struggles come from importing data from ill-mannered CSV files, the tedious task of orchestrating efficient data transformation, or the inevitable management of changes to tables. Data wrangling is rife with questionable ad-hoc solutions, which can sometimes even make things worse. The design rationale of DuckDB is to support the task of data wrangling by bringing the best of decades of data management research and best practices to the world of interactive data analysis in R or Python. For example, DuckDB has one of the world's most advanced CSV reader, native support for Parquet files and Arrow structures, an efficient parallel vectorized query processing engine, and support for efficient atomic updates to tables. All of this is wrapped up in a zero-dependency package available in a programming language near you for free. In my talk, I will discuss the above as well as the design rationale of DuckDB, which was designed and built in collaboration with the Data Science community in the first place.
Keep an eye out for whenever Posit announces the recordings are publicly available.
In the meantime, the workshop materials from posit::conf(2024) are available, including the “Databases in R” workshop, taught by Kirill Müller.
Workshop materials: https://github.com/posit-conf-2024/databases
Slides part 1: https://posit-conf-2024.github.io/databases/
Slides part 2: https://posit-conf-2024.github.io/databases/part-2
Slides part 3: https://posit-conf-2024.github.io/databases/part-3.html
Slides part 4: https://posit-conf-2024.github.io/databases/part-4.html
R-bloggers.com offers daily e-mail updates about R news and tutorials about learning R and many other topics. Click here if you're looking to post or find an R/data-science job.
Want to share your content on R-bloggers? click here if you have a blog, or here if you don't.