
PLANES: Plausibility Analysis of Epidemiological Signals
Want to share your content on R-bloggers? click here if you have a blog, or here if you don't.
This blog has moved. This is reposted from Paired Ends:
PLANES provides a set of methods for evaluating the plausibility of epidemiological signals and forecasts. The PLANES methods are available in the rplanes R package and Shiny app.
Since early 2023, we’ve been developing methods to conduct what we are calling plausibility analysis of epidemiological signals (PLANES). The motivation for PLANES stems from our work on infectious disease forecasting projects, including COVID-19, influenza-like illness (ILI), and influenza hospitalizations. Near-term forecasts of disease patterns can help guide public health decision-making. We’ve been fortunate enough to participate in several consortia efforts that openly solicit contributions from modelers using different methods. Those methods are often tailored to use training data that comes from epidemiological reporting systems. The openness of these forecasting “hubs” is invaluable, and can lead to ensemble forecasts that as a whole are greater than the sum of their parts.
But after all we’re trying to predict the future, so there are plenty of challenges! To name a few:
- The data for training and “gold-standard” truth assessments are maintained in complex reporting systems that are often distributed across jurisdictions.
- With the number of forecasters, forecast dates, targets (diseases), and locations, there are LOTS of incoming forecasts. And many of the hubs are designed on a weekly submission cadence, so that scale can grow even more dramatically as the season progresses.
- Hubs require that submissions include some representation of uncertainty such that they can communicate prediction intervals around each forecast. Depending on the modeling methods used, that estimate of uncertainty may be very different from forecast to forecast.
These particular challenges underscore a need for review of both the incoming surveillance data and forecasts that are generated. But that review requires human intuition — a “gut feeling” — and it can be hard to scale.
Enter PLANES. We developed this approach to reduce the burden of human review for epidemiological signals. The aim here is to mirror human intuition, but not replace it. In other words, by flagging implausibility we are not claiming impossibility. Instead, the approach provides a screening mechanism so that humans can take a closer look at the signal data. PLANES is agnostic, such that it can be used across either forecasted or observed signals, for different diseases, and for varying temporal and geographic resolutions. The PLANES methods are described in detail in a manuscript we published in August 2024:
Nagraj VP, Benefield AE, Williams D, & Turner SD. (2024). PLANES: Plausibility Analysis of Epidemiological Signals. medRxiv, 10.1101/2024.08.22.24312449.
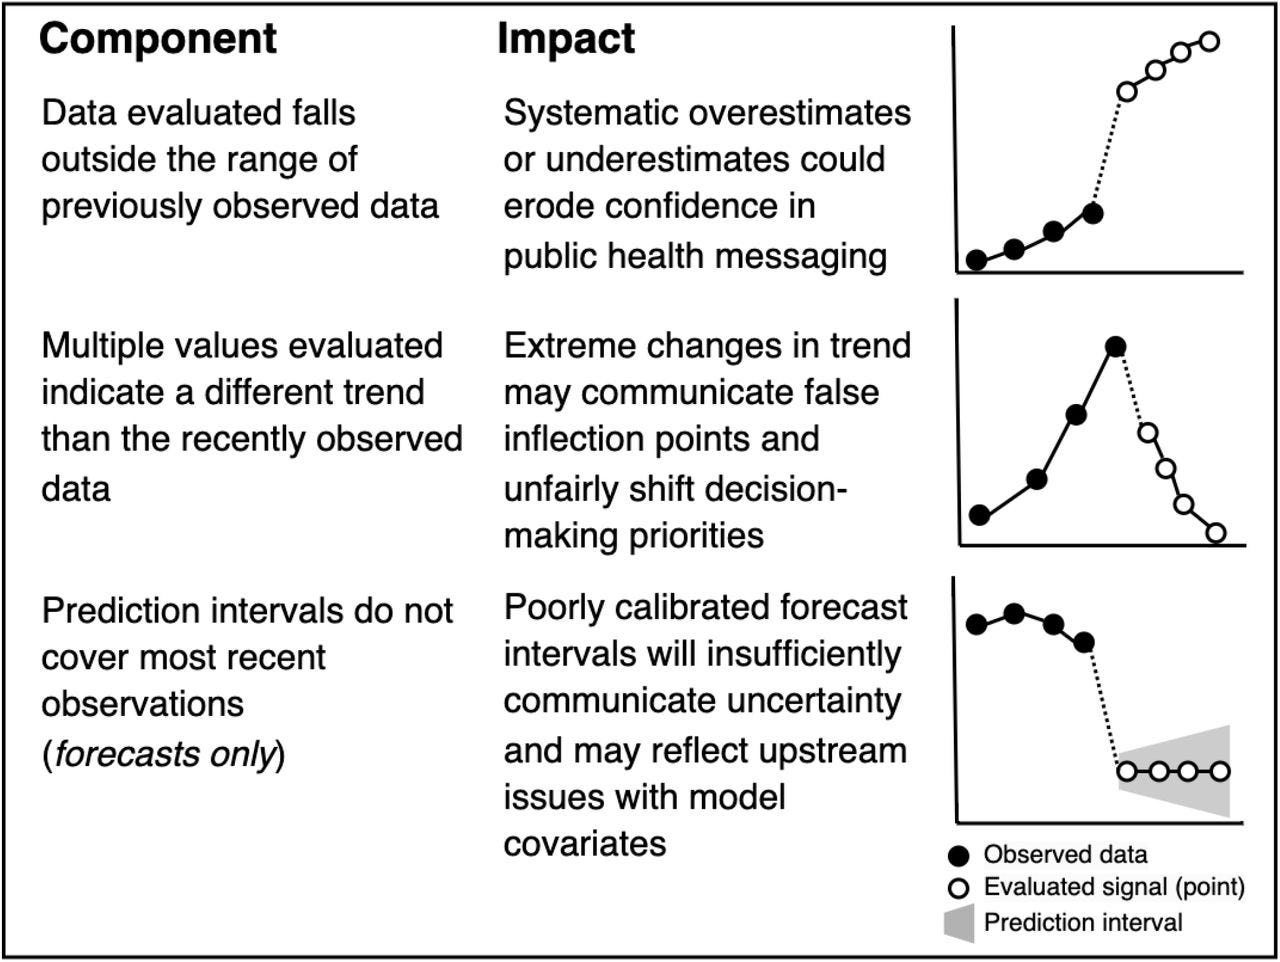
The concept behind the algorithm is demonstrated in Supplemental Figure A1 from the manuscript (below), which illustrates notional components and impacts.
Once we established the PLANES methods, we moved on to the rplanes R package to implement this approach.
PLANES components
A human can look at a time series of epidemiological data (e.g., incident influenza hospitalizations) and a probabilistic near-term forecast, and get a good sense of whether the forecast “looks weird” or not. PLANES attempts to systematize and formalize this assessment such that it can be automated and scaled. We created multiple components, each of which is a binary (yes/no) assessment of plausibility that maps to some feature in the data. All evaluated components are then combined into an ordinal score. By default, each component is equally weighted in the overall PLANES score. When delivered in the rplanes R package, the user can optionally weight components higher or lower in the scoring scheme.
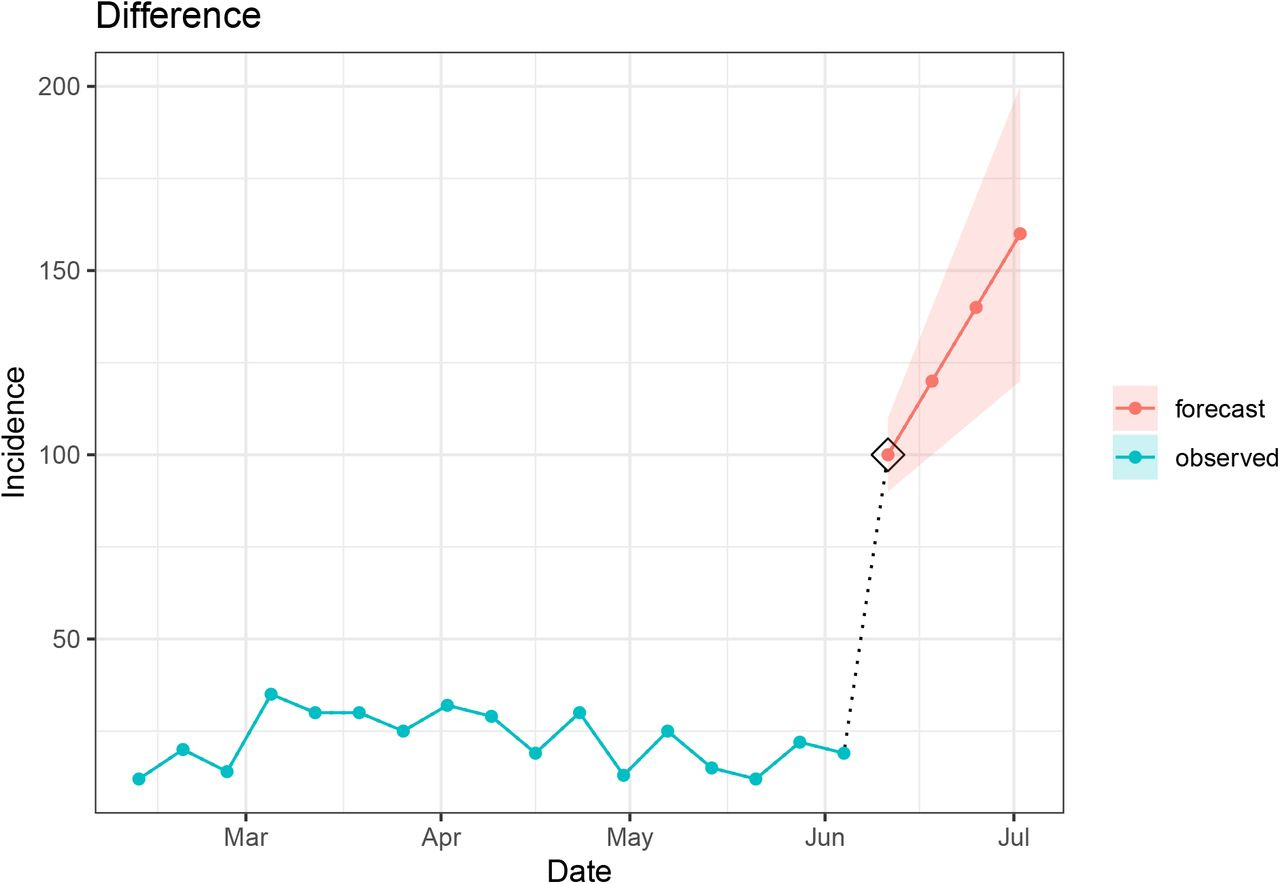
1. Difference
The difference component checks the magnitude of point-to-point differences for all time steps of the evaluated data. This component can be used on either forecasts or observed signals. If an evaluated signal departs from the prior observation more dramatically than has been seen previously in the time series, then it is flagged as implausible. The function internally computes the maximum observed difference (based on absolute value) to set a threshold, which if exceeded will trigger a flag to be raised by the algorithm. While large and unexpected point-to-point changes may naturally occur in epidemiological signals, this component provides a means to draw attention to the most extreme cases.
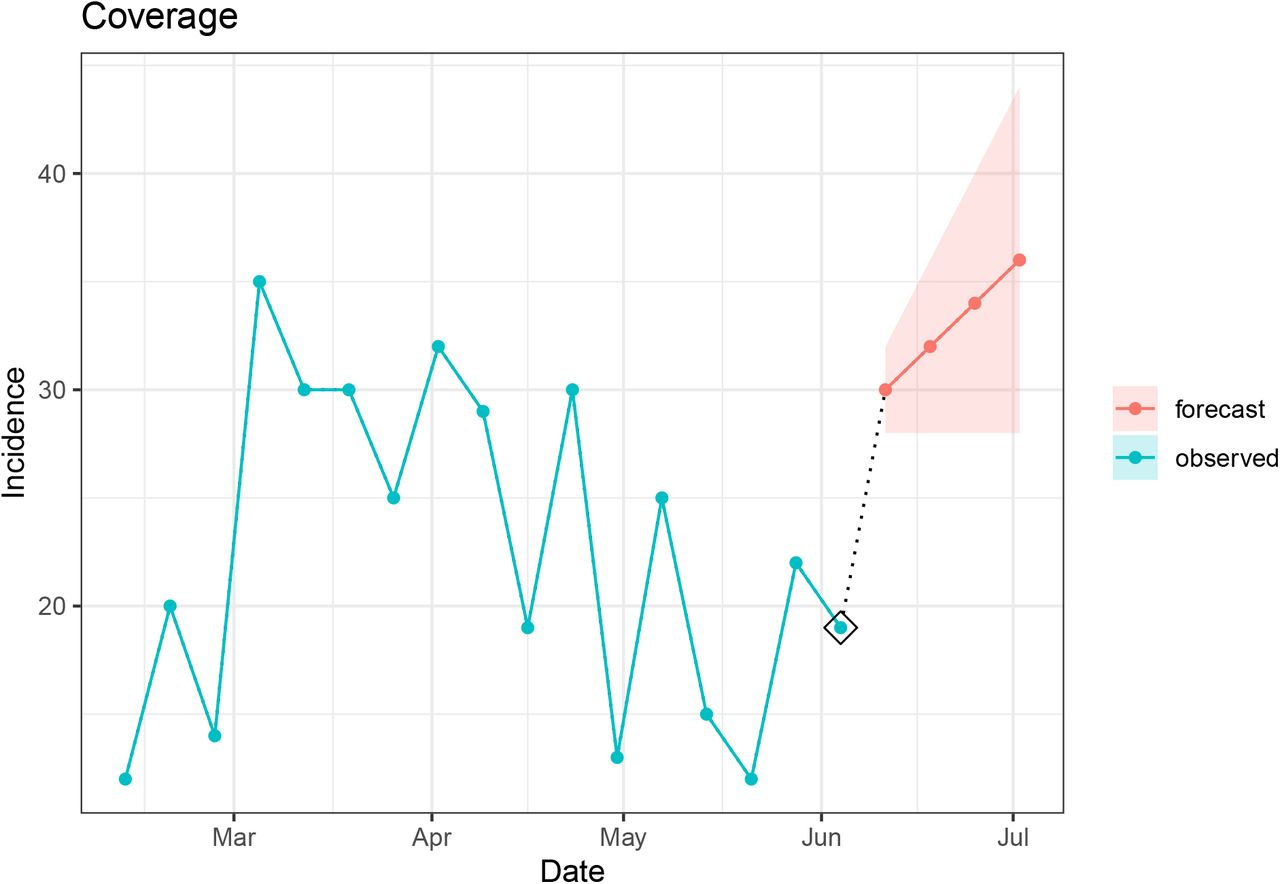
2. Coverage
The coverage component compares the prediction interval for the first horizon of the evaluated signal to the most recent value in the seed. If the interval does not cover the most recent data point, then the flag is raised as implausible. The width of the interval used for this evaluation can be customized. The narrower the width of the prediction interval, the more sensitive this component will be.
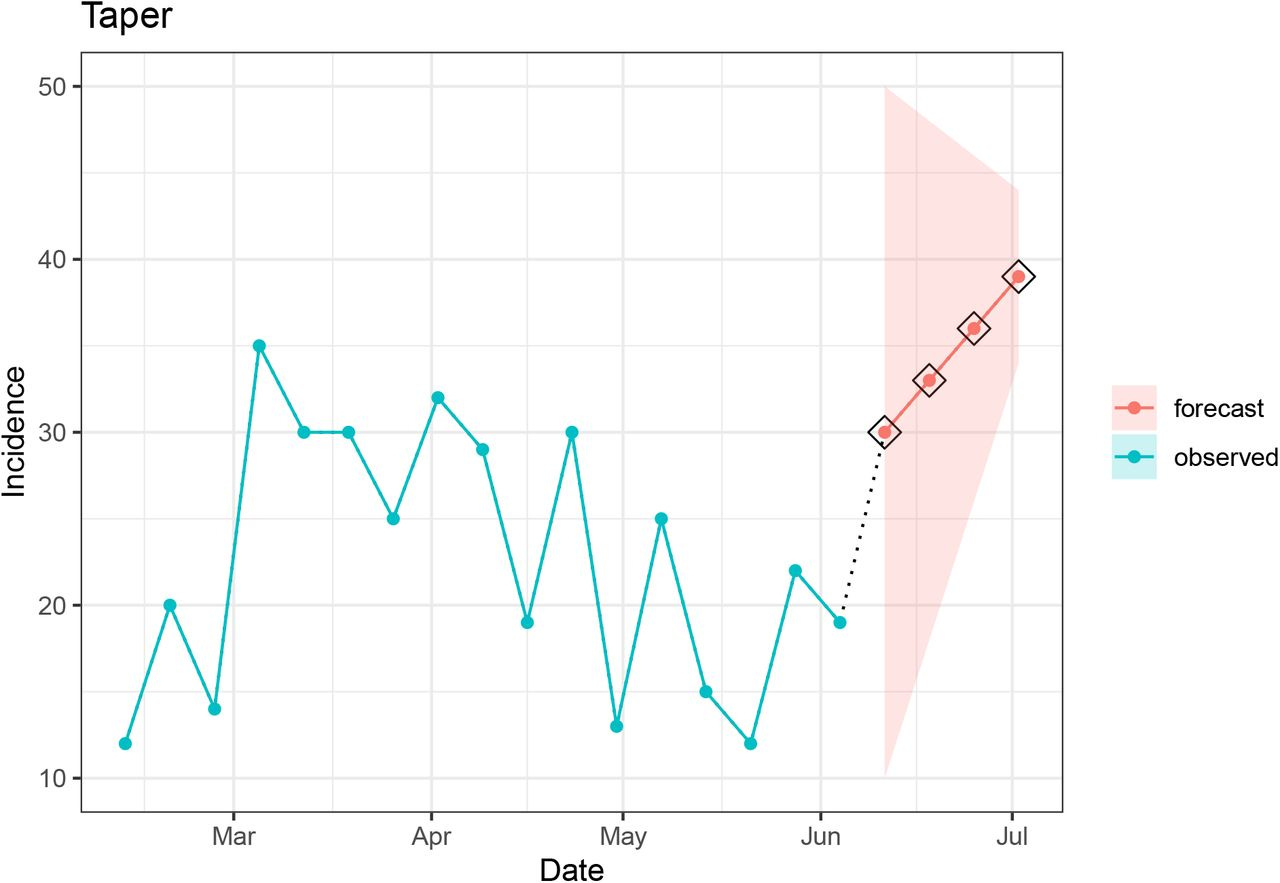
3. Taper
The taper component checks whether the prediction interval for the evaluated signal decreases in width (i.e., certainty increases) as horizons progress. The width of the prediction interval at every horizon is assessed against the previous horizon and if any of the intervals for the earlier horizon is wider a flag is raised. One would expect that there would be more variability in signals forecasted further out in time, and therefore the prediction interval would be wider in later horizons.
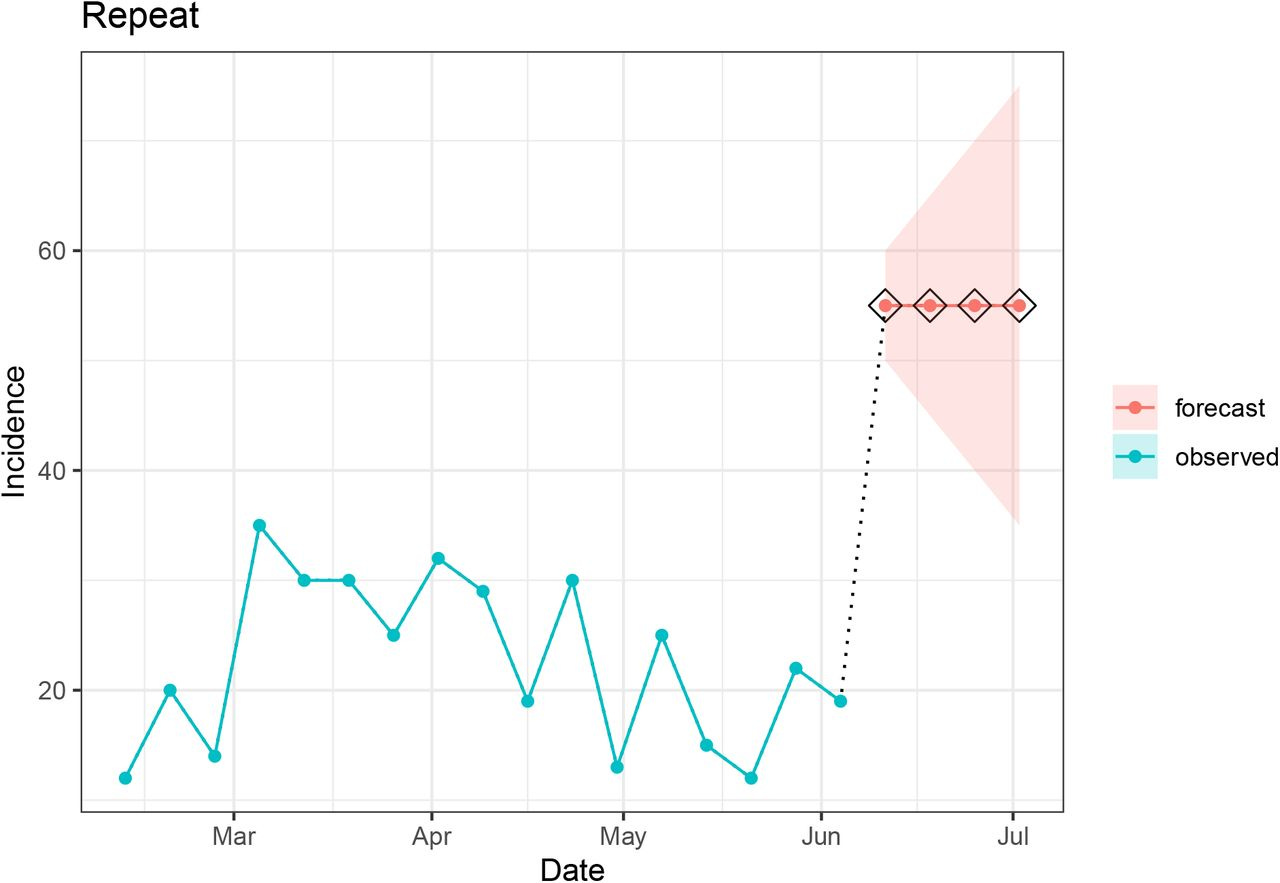
4. Repeat
The repeat component checks whether consecutive values in an observed or forecasted signal are repeated more than the tolerated number of times (k). This stores the maximum number of consecutive repeats for each location and uses this as the default value for k. If the evaluated data exceeds k, then the signal is considered implausible and a flag is raised.
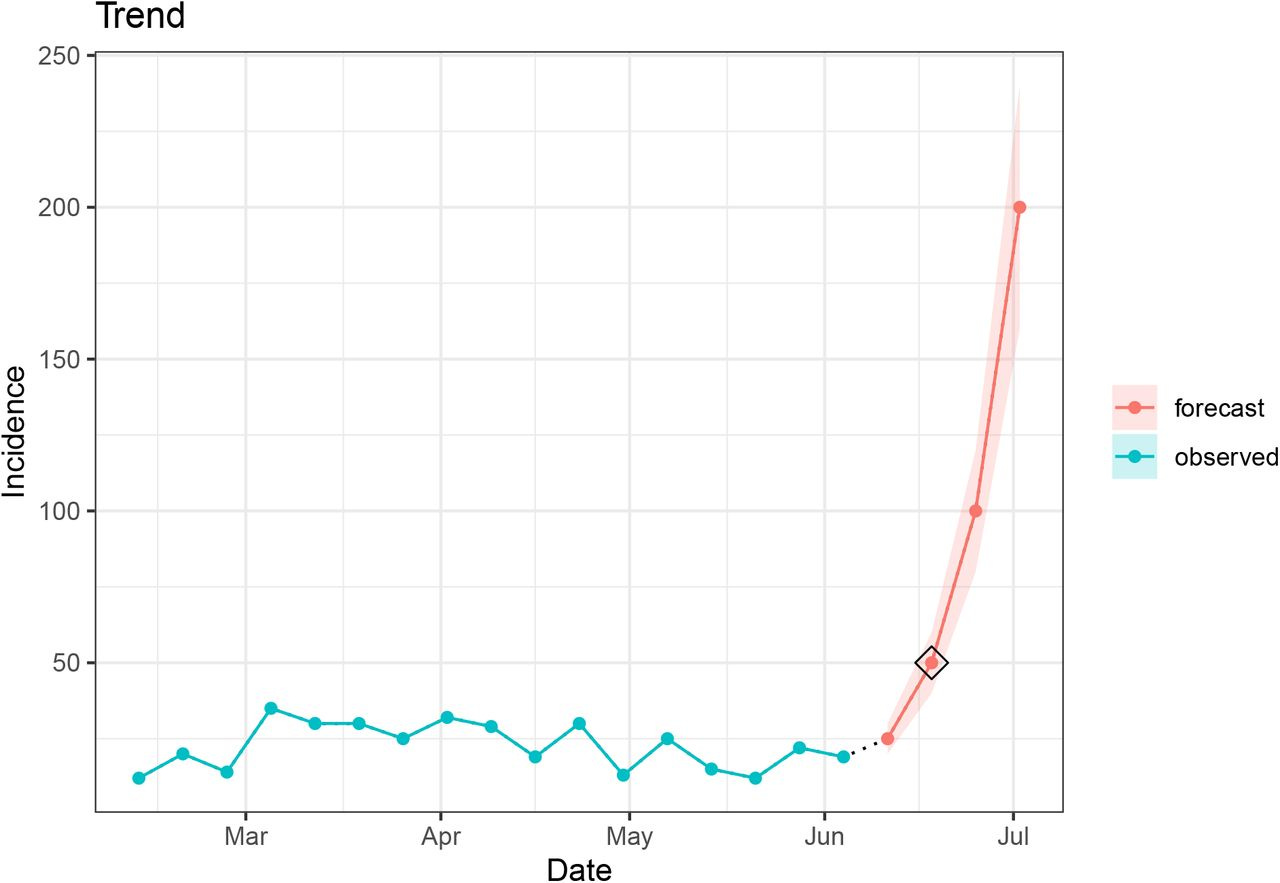
5. Trend
The trend component assesses if there is a significant change in the magnitude or direction of the slope for the evaluated signal compared to the most recent data in the seed. Each “change point” in the signal is identified using a hierarchical divisive algorithm originally implemented in the ecp R package.
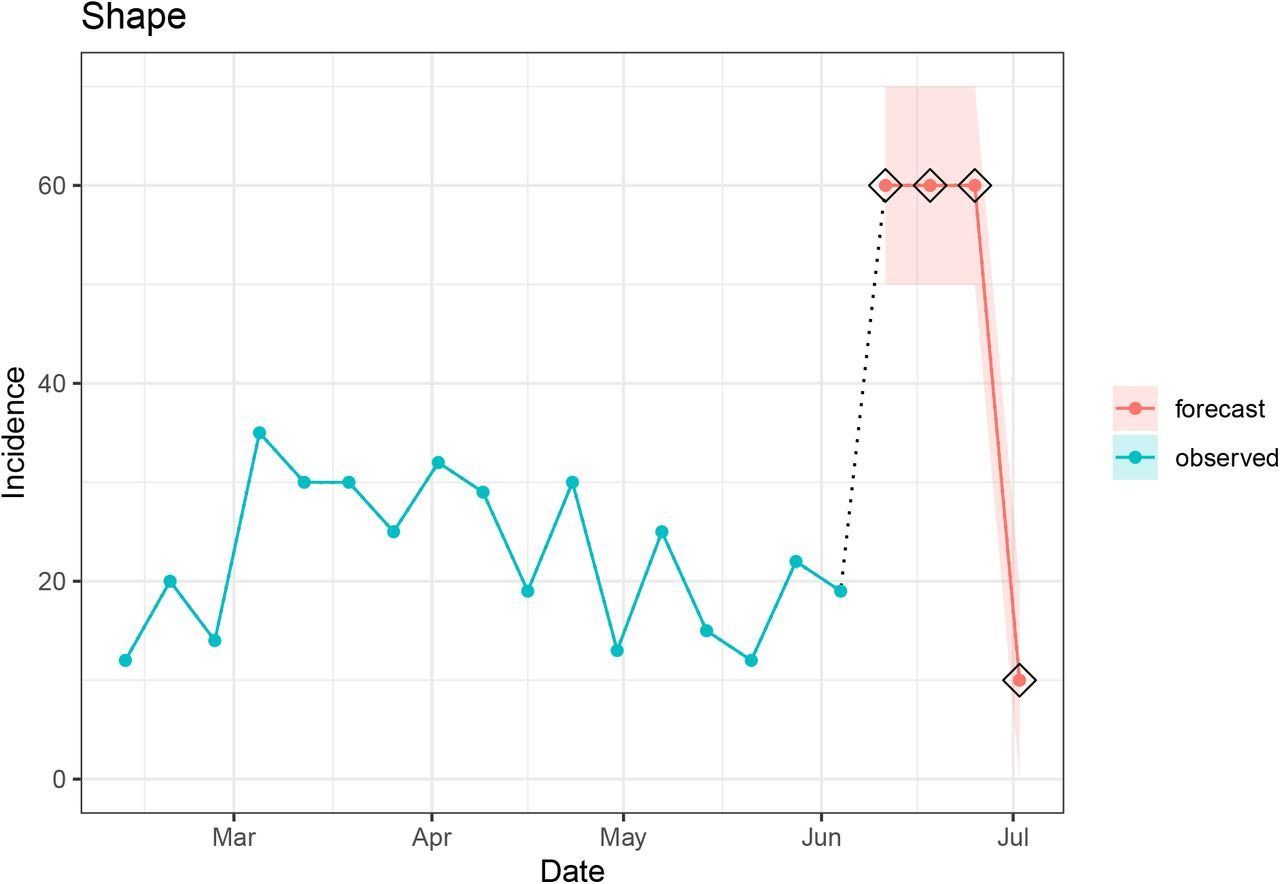
6. Shape
While the trend component scans the time series for an inflection point, the shape component assesses the time series for unusual shapes across multiple points. To arrive at the shape assessment, the algorithm first divides the observed seed data into sliding windows to form trajectories. The trajectories are summarized as a set of shapes against which the forecasted trajectory is compared. If the shape of the forecasted trajectory does not match any shapes in the seed data, then the forecast is considered implausible per this component. The core intuition underlying this component is that the shape of future data is more likely to reflect patterns that have previously been observed and less likely to be a novel trajectory. Therefore, it may be useful to flag any novel shapes for review. The PLANES paper describes the two methods we used (dynamic time warping, and differences of consecutive observations) to summarize the shapes of signal trajectories.
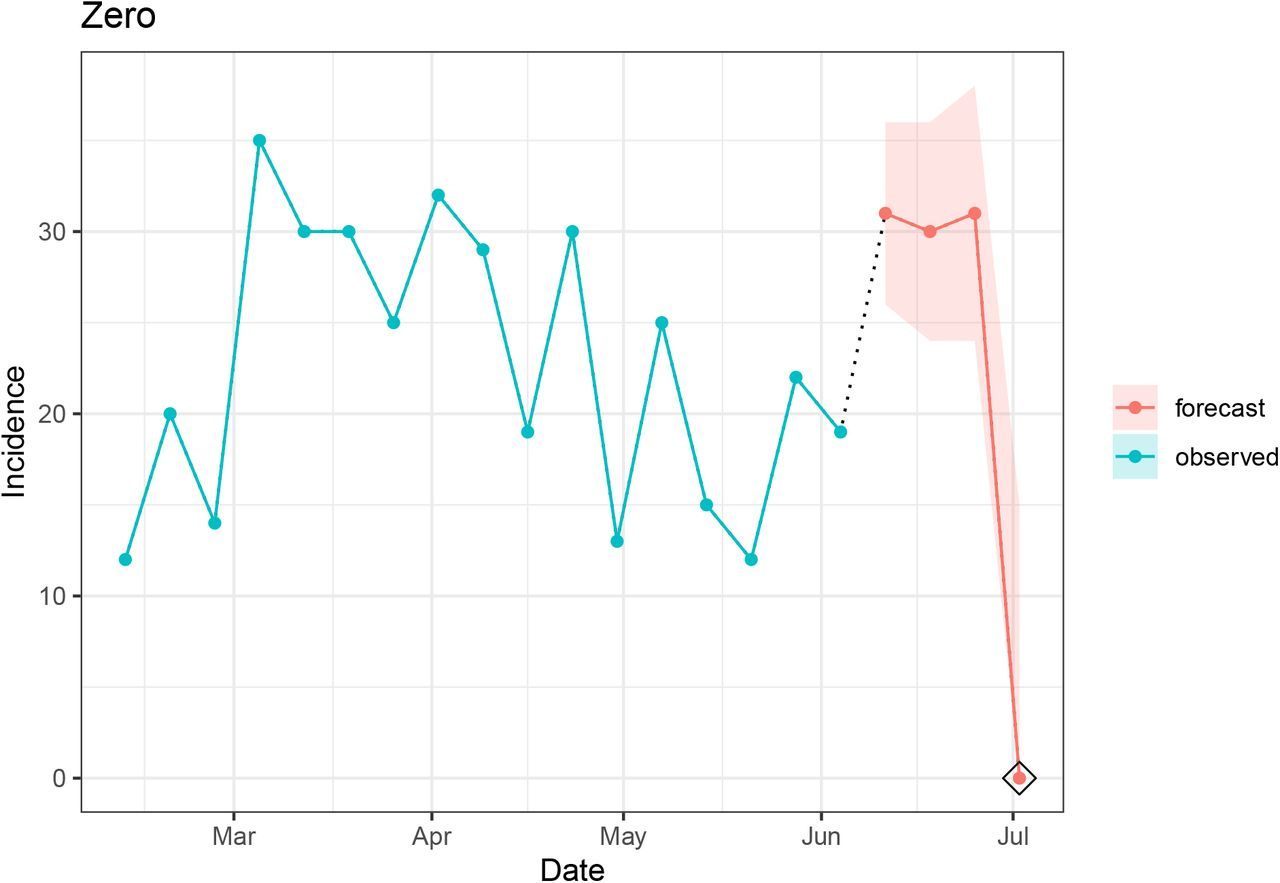
7. Zero
The zero component was designed to check if there are any “sudden” zeros in the evaluated signal. Whether it is a broken surveillance instrument or miscalibrated forecast, we expect it would be unlikely to observe a zero if it has never been reported in the signal data.
Now that we’ve covered all of the individual PLANES components, let’s take a look at the rplanes R package, which implements functions and a Shiny app to evaluate epidemiological signals and forecasts for these components.
R package: rplanes
rplanes is released under an open-source license, with code, documentation and issue tracking on GitHub: https://github.com/signaturescience/rplanes.
The package is also released on CRAN: https://cran.r-project.org/package=rplanes.
The package website includes function documentation, reproducible examples, and narrative vignettes describing how to get started as well as advanced usage of the tool: https://signaturescience.github.io/rplanes/.
We tried to develop rplanes to be as intuitive as possible. Before assessing the individual PLANES components that we defined, we needed to ensure that user data was formatted consistently. We also needed a structure to store location-specific baseline characteristics against which we could compare the evaluated signal. With this in mind, we created an object-oriented structure using S3 classes in R. The figure below walks through the workflow for preparing data and analyzing data in rplanes.
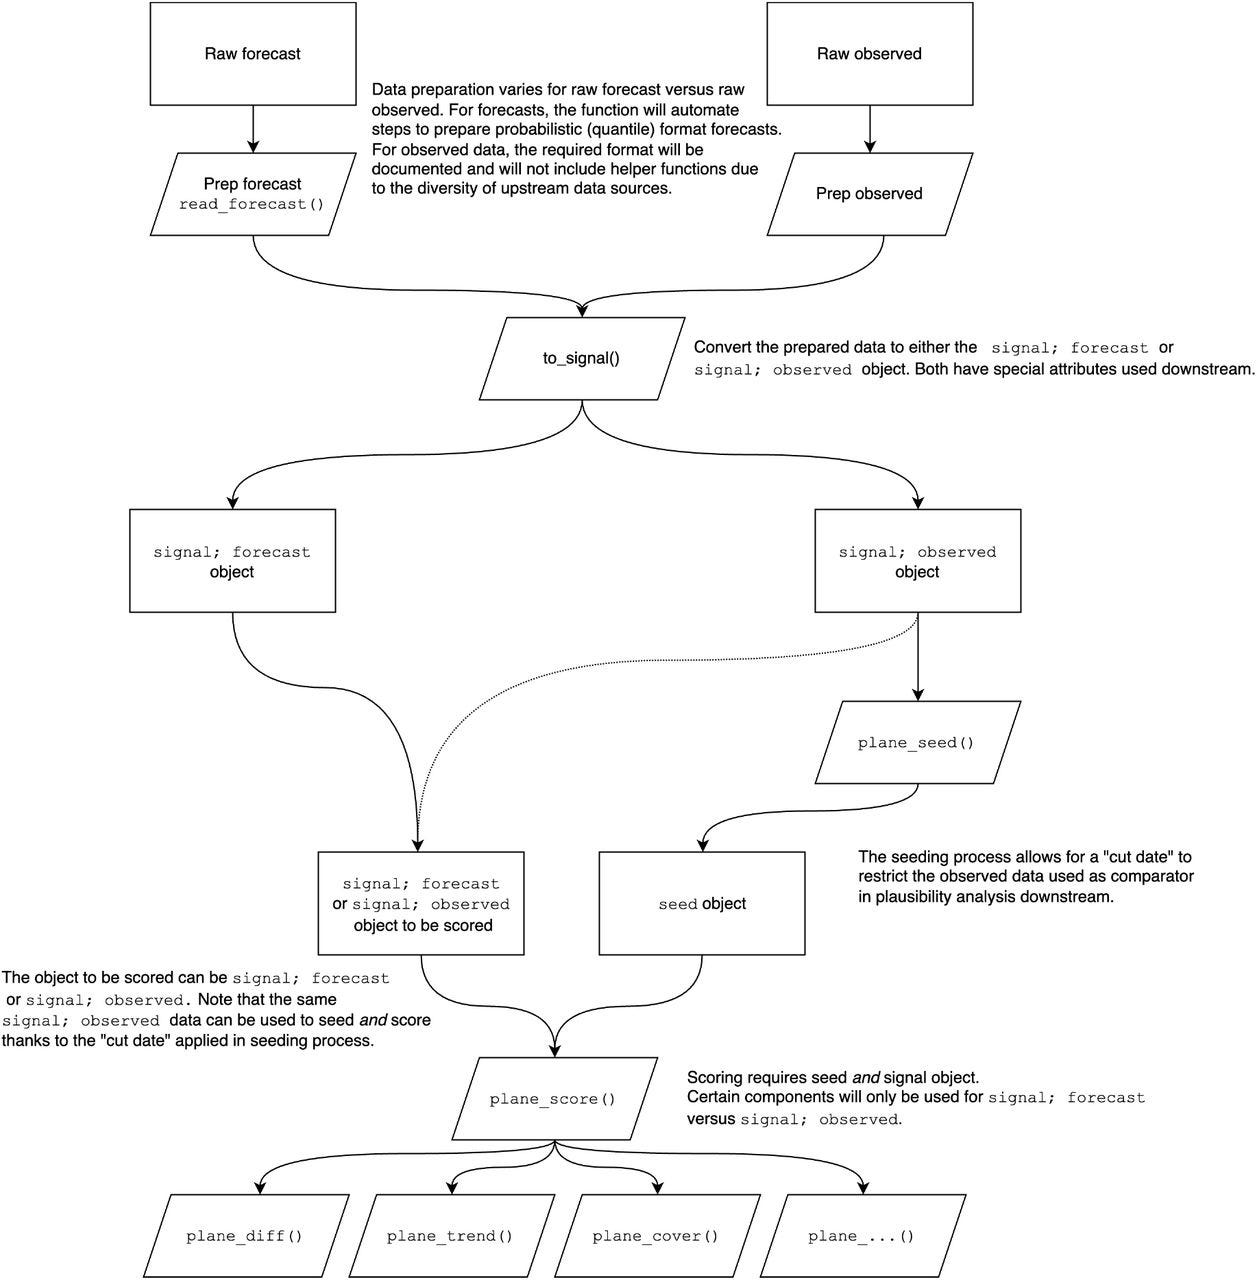
The rplanes package has several vignettes illustrating basic usage, detailed descriptions of the PLANES components, interpreting plausibility scores, and the rplanes explorer shiny app.
rplanes explorer
In addition to a programmatic interface, we included a point-and-click version of the tool. This is developed as a Shiny app that is built into rplanes. We’ve translated all of the package functionality to widgets in the app. To launch the app simply run rplanes_explorer().
rplanes_explorer(). For details, see the rplanes explorer vignette.R-bloggers.com offers daily e-mail updates about R news and tutorials about learning R and many other topics. Click here if you're looking to post or find an R/data-science job.
Want to share your content on R-bloggers? click here if you have a blog, or here if you don't.