
Use R to prompt a local LLM with ollamar
Want to share your content on R-bloggers? click here if you have a blog, or here if you don't.
This is reposted from the original article:
https://blog.stephenturner.us/p/use-r-to-prompt-a-local-llm-with
Use R to prompt a local LLM with ollamar: Using R to prompt llama3.1:70b running on my laptop with Ollama + ollamar to tell me what’s interesting about a set of genes, and to summarize recent bioRxiv preprints
ollama run llama3.1:70b) or via a familiar GUI with the open-webui Docker container.Here I’ll demonstrate using the ollamar package on CRAN to talk to an LLM running locally on my Mac. I’ll demonstrate this by asking llama3.1-70b what it thinks about a set of genes1 and to summarize recent preprints published on bioRxiv’s Scientific Communication and Education channel using the smaller+faster 8B model.
Tell me what’s interesting about these genes
Genes involved in the G2/M checkpoint
First I’ll use the msigdbr R package to pull the gene symbols for all the genes involved in the G2/M checkpoint in the cell cycle progression from MSigDb.
library(msigdbr)
hm <- msigdbr(species="human", category="H")
gs <- unique(hm[hm$gs_name=="HALLMARK_G2M_CHECKPOINT",]$gene_symbol)
Next, I’ll load the ollamar package, and test the connection to the Ollama server.
library(ollamar)
test_connection()
If all goes well you should see something like the following:
Ollama local server running
<httr2_response>
GET http://localhost:11434/
Status: 200 OK
Content-Type: text/plain
Body: In memory (17 bytes)
The ollamar README has good documentation on how to pull models, list which models you have available, etc.
Next, I’ll collapse the gene symbol vector I created above to a string (“CDK1, SMC2, POLA2, …”), and create a prompt tacking on this list of gene symbols to the end. Finally, I’ll use the generate() function with this prompt I just created to prompt the llama3.1:70b2 model, and print the results.
# Collapse the symbol vector to a string ("GENE1, GENE2, GENE3")
gs_string <- paste(gs, collapse=", ")

# Create a prompt
prompt <- paste("I'm going to give you some gene symbols.
                Anything interesting about this gene set? ",
                gs_string)

# Prompt the model
res <- generate("llama3.1:70b", prompt=prompt, output="text")

# Print the results
cat(res$response)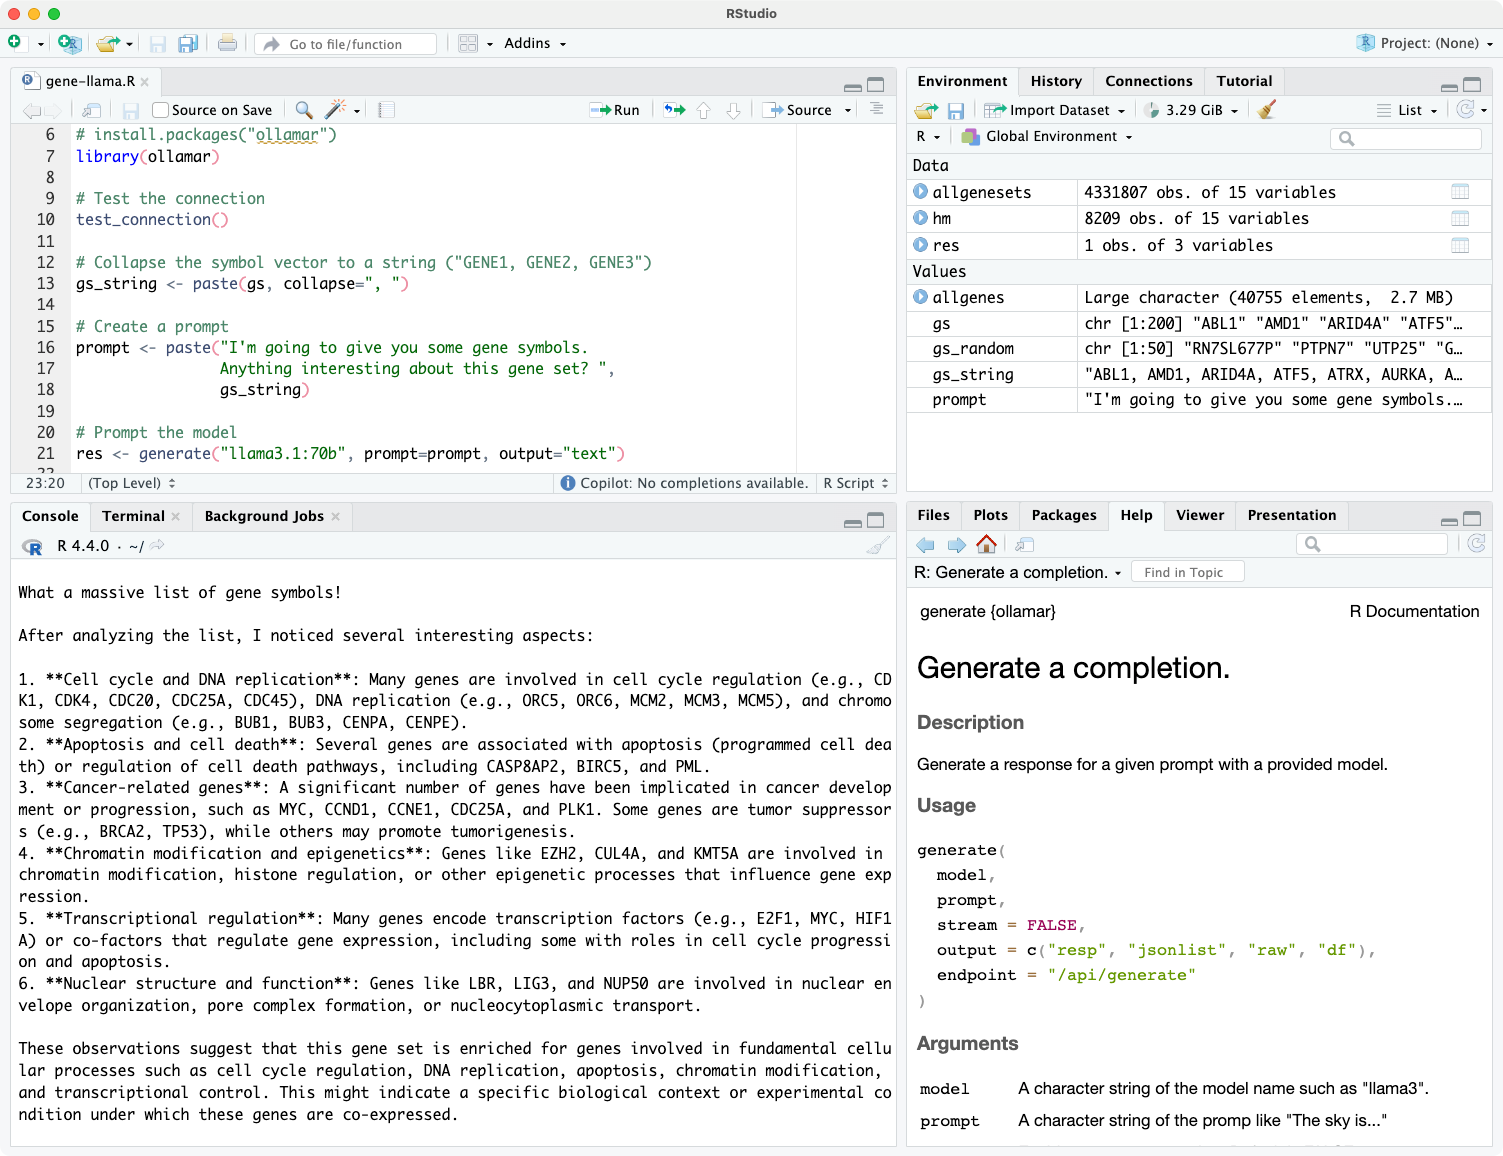
The prompt returns markdown text which looks nice after rendering with RMarkdown/Quarto:
What a massive list of gene symbols!
After analyzing the list, I noticed several interesting aspects:
Cell cycle and DNA replication: Many genes are involved in cell cycle regulation (e.g., CDK1, CDK4, CDC20, CDC25A, CDC45), DNA replication (e.g., ORC5, ORC6, MCM2, MCM3, MCM5), and chromosome segregation (e.g., BUB1, BUB3, CENPA, CENPE).
Apoptosis and cell death: Several genes are associated with apoptosis (programmed cell death) or regulation of cell death pathways, including CASP8AP2, BIRC5, and PML.
Cancer-related genes: A significant number of genes have been implicated in cancer development or progression, such as MYC, CCND1, CCNE1, CDC25A, and PLK1. Some genes are tumor suppressors (e.g., BRCA2, TP53), while others may promote tumorigenesis.
Chromatin modification and epigenetics: Genes like EZH2, CUL4A, and KMT5A are involved in chromatin modification, histone regulation, or other epigenetic processes that influence gene expression.
Transcriptional regulation: Many genes encode transcription factors (e.g., E2F1, MYC, HIF1A) or co-factors that regulate gene expression, including some with roles in cell cycle progression and apoptosis.
Nuclear structure and function: Genes like LBR, LIG3, and NUP50 are involved in nuclear envelope organization, pore complex formation, or nucleocytoplasmic transport.
These observations suggest that this gene set is enriched for genes involved in fundamental cellular processes such as cell cycle regulation, DNA replication, apoptosis, chromatin modification, and transcriptional control. This might indicate a specific biological context or experimental condition under which these genes are co-expressed.
Would you like to know more about any of these aspects or explore further?
Random genes
For kicks I did this with a random selection of 50 genes from the human genome:
allgenesets <- msigdbr(species="Homo sapiens")
allgenes <- unique(allgenesets$gene_symbol)
set.seed(42)
gs_random <- sample(allgenes, 50)
Llama3.1 is doing a good job HARKing about what these genes could be doing:
After analyzing the list, I noticed a few interesting things:
High proportion of pseudogenes: About 20-25% of the genes on your list are labeled as "pseudogenes" (e.g., RN7SL677P, RPL27AP3, HYAL6P). Pseudogenes are inactive copies of functional genes that have lost their ability to code for proteins. They can still be transcribed and play roles in regulating gene expression.
Ribosomal protein pseudogenes: Many of the pseudogenes on your list (e.g., RPL27AP3, RN7SL677P) appear to be related to ribosomal proteins, which are essential for protein synthesis.
MicroRNAs and small nuclear RNAs: You have several microRNA genes (MIRs) and small nuclear RNA (snRNA) genes on your list (e.g., MIR4444-2, RNU7-160P). These types of non-coding RNAs play crucial roles in regulating gene expression.
Tyrosine phosphatase and kinases: The presence of PTPN7 (a tyrosine phosphatase) and TYK2 (a Janus kinase) on your list suggests a possible connection to signaling pathways involved in cell growth, differentiation, or immune responses.
Vascular endothelial growth factor A (VEGFA): This gene is crucial for angiogenesis (the formation of new blood vessels). Its presence on your list might indicate a role in vascular development or disease.
These observations are just a starting point, and further analysis would be needed to determine the significance of these genes in a specific biological context. Do you have any additional information about how this gene set was obtained or what type of study it's related to?
Summarize the latest papers on bioRxiv
Above I created a single prompt with a single call to generate(). Here I’ll create many prompts based on data in columns of a data frame, and purrr::map() the generate() function over all of those prompts to create a new column of responses in my data frame.
I’ll demonstrate this by asking for a two sentence summary of the most recent bioRxiv preprints. I’ll start by pulling the latest titles and abstracts from the Scientific Communication and Education channel on bioRxiv. I use the tidyrss package to pull this information directly from the bioRxiv RSS feed. This returns a data frame with title, abstract, and other information about the most recent preprints in the feed.
library(tidyRSS)
library(tidyverse)

# Parse the feed
feed <- tidyfeed("https://connect.biorxiv.org/biorxiv_xml.php?subject=scientific_communication_and_education")

# Show a few titles
head(feed$item_title, 3)

# Show a few abstracts
head(feed$item_description, 3)
Here are the latest three titles (as of August 3, 2024).3 The abstracts that go with them (not shown) are in the feed$item_description column.
[1] "\nBiological changes, political ideology, and scientific communication shape human perceptions of pollen seasons \n"
[2] "\nAn updated and expanded characterization of the biological sciences academic job market \n"
[3] "\n\"I'd like to think I'd be able to spot one if I saw one\": How science journalists navigate predatory journals \n"
Next, I’ll take the first 20 lines of the feed, pull out the title and abstract with the select statement, remove leading and trailing whitespace with the first mutate, construct a prompt with the second mutate, and generate a response with llama3.1 with the last mutate with purrr::map_chr(). Here I’m using the smaller/faster llama3.1:8b model (the default unless you specify :70b).
summarized <-
  feed |>
  head(20) |>
  select(title=item_title, abstract=item_description) |>
  mutate(across(everything(), trimws)) |>
  mutate(prompt=paste(
    "\n\nI'm going to give you a paper's title and abstract.",
    "Can you summarize this paper in 2 sentences?",
    "\n\nTitle: ", title, "\n\nAbstract: ", abstract)) |>
  mutate(response=purrr::map_chr(prompt, \(x)
                                 generate("llama3.1",
                                          prompt=x,
                                          output="text")$response))
This is an example prompt, which will get run for every title and abstract in the feed:
I'm going to give you a paper's title and abstract. Can you summarize this paper in a few sentences?

Title:  An updated and expanded characterization of the biological sciences academic job market

Abstract:  In the biological sciences, many areas of uncertainty exist regarding the factors that contribute to success within the faculty job market. Earlier work from our group reported that beyond certain thresholds, academic and career metrics like the number of publications, fellowships or career transition awards, and years of experience did not separate applicants who received job offers from those who did not. Questions still exist regarding how academic and professional achievements influence job offers and if candidate demographics differentially influence outcomes. To continue addressing these gaps, we initiated surveys collecting data from faculty applicants in the biological sciences field for three hiring cycles in North America (Fall 2019 to the end of May 2022), a total of 449 respondents were included in our analysis. These responses highlight the interplay between various scholarly metrics, extensive demographic information, and hiring outcomes, and for the first time, allowed us to look at persons historically excluded due to ethnicity or race (PEER) status in the context of the faculty job market. Between 2019 and 2022, we found that the number of applications submitted, position seniority, and identifying as a women or transgender were positively correlated with a faculty job offer. Applicant age, residence, first generation status, and number of postdocs, however, were negatively correlated with receiving a faculty job offer. Our data are consistent with other surveys that also highlight the influence of achievements and other factors in hiring processes. Providing baseline comparative data for job seekers can support their informed decision-making in the market and is a first step towards demystifying the faculty job market.
Now the response column in my new table has all the responses from the LLM. I can now put the title and summary in a table and render it with pandoc.
summarized |>
  select(title, response) |>
  mutate(response=gsub("\n", " ", response)) |>
  knitr::kable()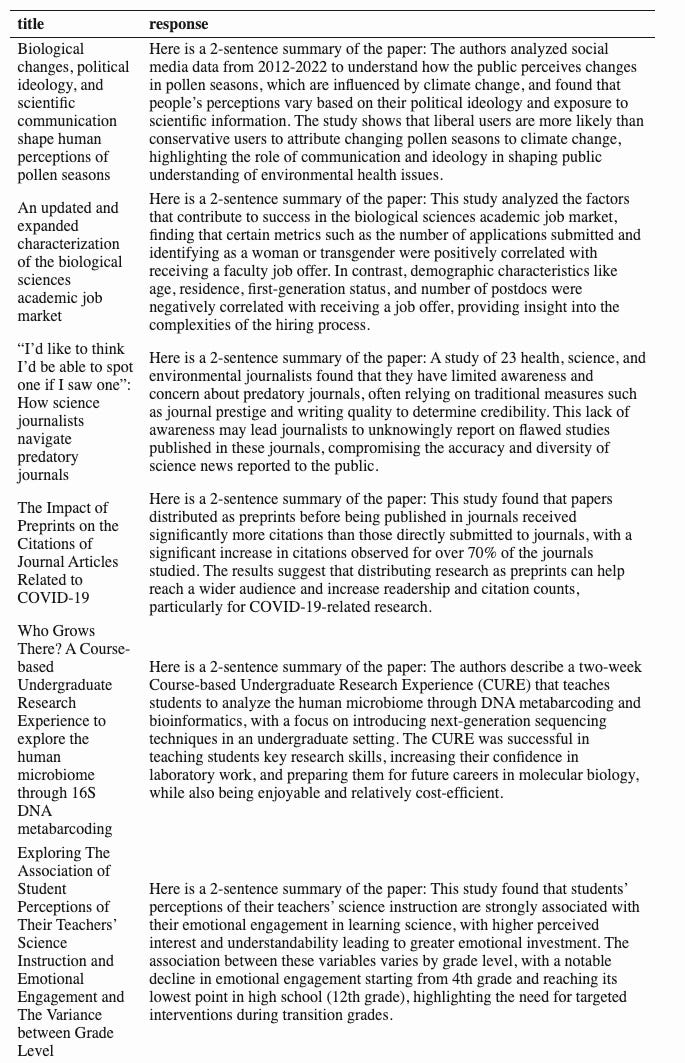
R-bloggers.com offers daily e-mail updates about R news and tutorials about learning R and many other topics. Click here if you're looking to post or find an R/data-science job.
Want to share your content on R-bloggers? click here if you have a blog, or here if you don't.