2022

Spiders, facets, and dots, oh my!

August 20, 2022 | Layton R blog

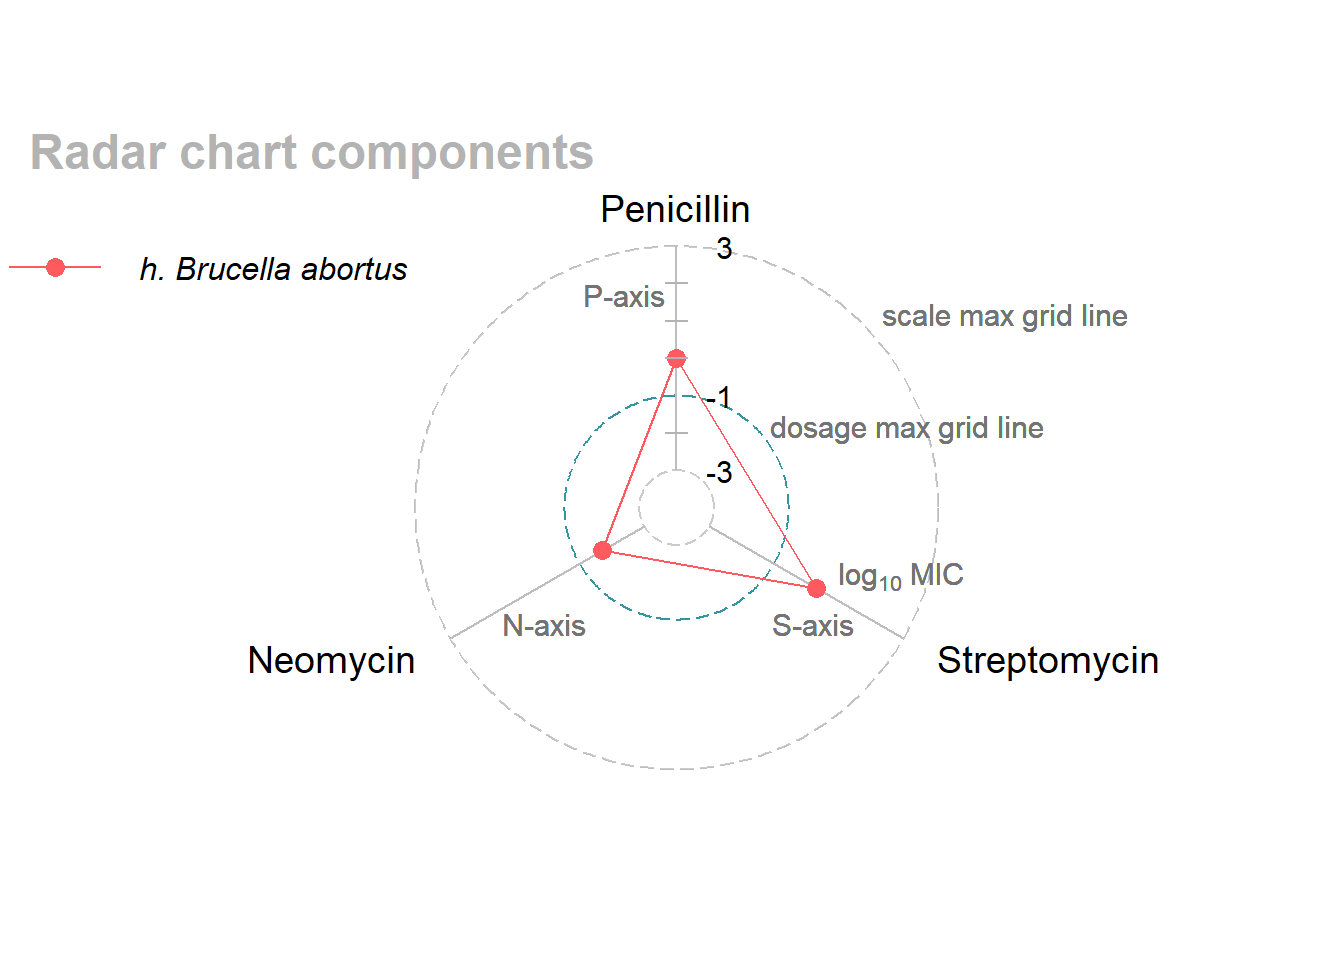
Summary I compare the effectiveness of two charts—a radar (or spider) chart and a faceted dot chart—in communicating information about Burtin’s 1951 antibiotics/bacteria data. The faceted dot chart is more effective, suggesting in general...
[Read more...]

Is Data Science a Dying Profession?

August 19, 2022 | Jim

The post Is Data Science a Dying Profession? appeared first on Data Science Tutorials Is Data Science a Dying Profession?, Some of the articles discussed ML engineers will take the position of data scientists in the future years. The majority of businesses, according to some of the recent articles, used ... [Read more...]

Online Shiny Training von eoda – Erzählen Sie Ihre Data Story

August 19, 2022 | eoda GmbH

Our Shiny trainings return! In September and November 2022 our certified instructors teach you how to make your data come to life. As a Full Service Partner of RStudio and leading Shiny expert, we empower you to independently develop successful Shiny apps for productive use in our German-speaking online trainings.  What ...
[Read more...]

How to Label Outliers in Boxplots in ggplot2?

August 18, 2022 | Jim

The post How to Label Outliers in Boxplots in ggplot2? appeared first on Data Science Tutorials How to Label Outliers in Boxplots in ggplot2, This article offers a detailed illustration of how to name outliers in ggplot2 boxplots. Step 1: Construct the data frame. Create the following data frame first, which ...
[Read more...]

Difference Between cat() and paste() in R

August 18, 2022 | finnstats

The post Difference Between cat() and paste() in R appeared first on finnstats. If you are interested to learn more about data science, you can find more articles here finnstats. Difference Between cat() and paste() in R, you can concatenate strings together using both the cat() and paste() functions, however, ... [Read more...]

How to generate data from a model – Part 1

August 17, 2022 | Sidharth Macherla

Summary Traditionally, data scientists have built models based on data. This article details how to do the exact opposite i.e. generate data based on a model. This article is first in the series of articles on building data from model.  Motivation & Practical Applications Businesses across various industry domains are ... [Read more...]

Tinier 0.5.0

August 17, 2022 | » R

I had some time on my hands in the last few weeks while I wait to start a new job, so I went back to the tinieR package to fiddle around! New things - petit_plot I’d long wanted to find a way to export plots directly from R ... [Read more...]

Hurst Exponent using R code

August 16, 2022 | sang-heon lee

This post explains how to estimate the Hurst exponent which indicates characteristics of a time series : mean-reversion, random walk, and trending with long memory using S&P 500 index returns. Hurst Exponent Pairs trading literatur...
[Read more...]
1 22 23 24 25 26 89

Never miss an update!
Subscribe to R-bloggers to receive
e-mails with the latest R posts.
(You will not see this message again.)

Click here to close (This popup will not appear again)