2022

Bio7 3.4 Released!

April 1, 2022 | Marcel Austenfeld

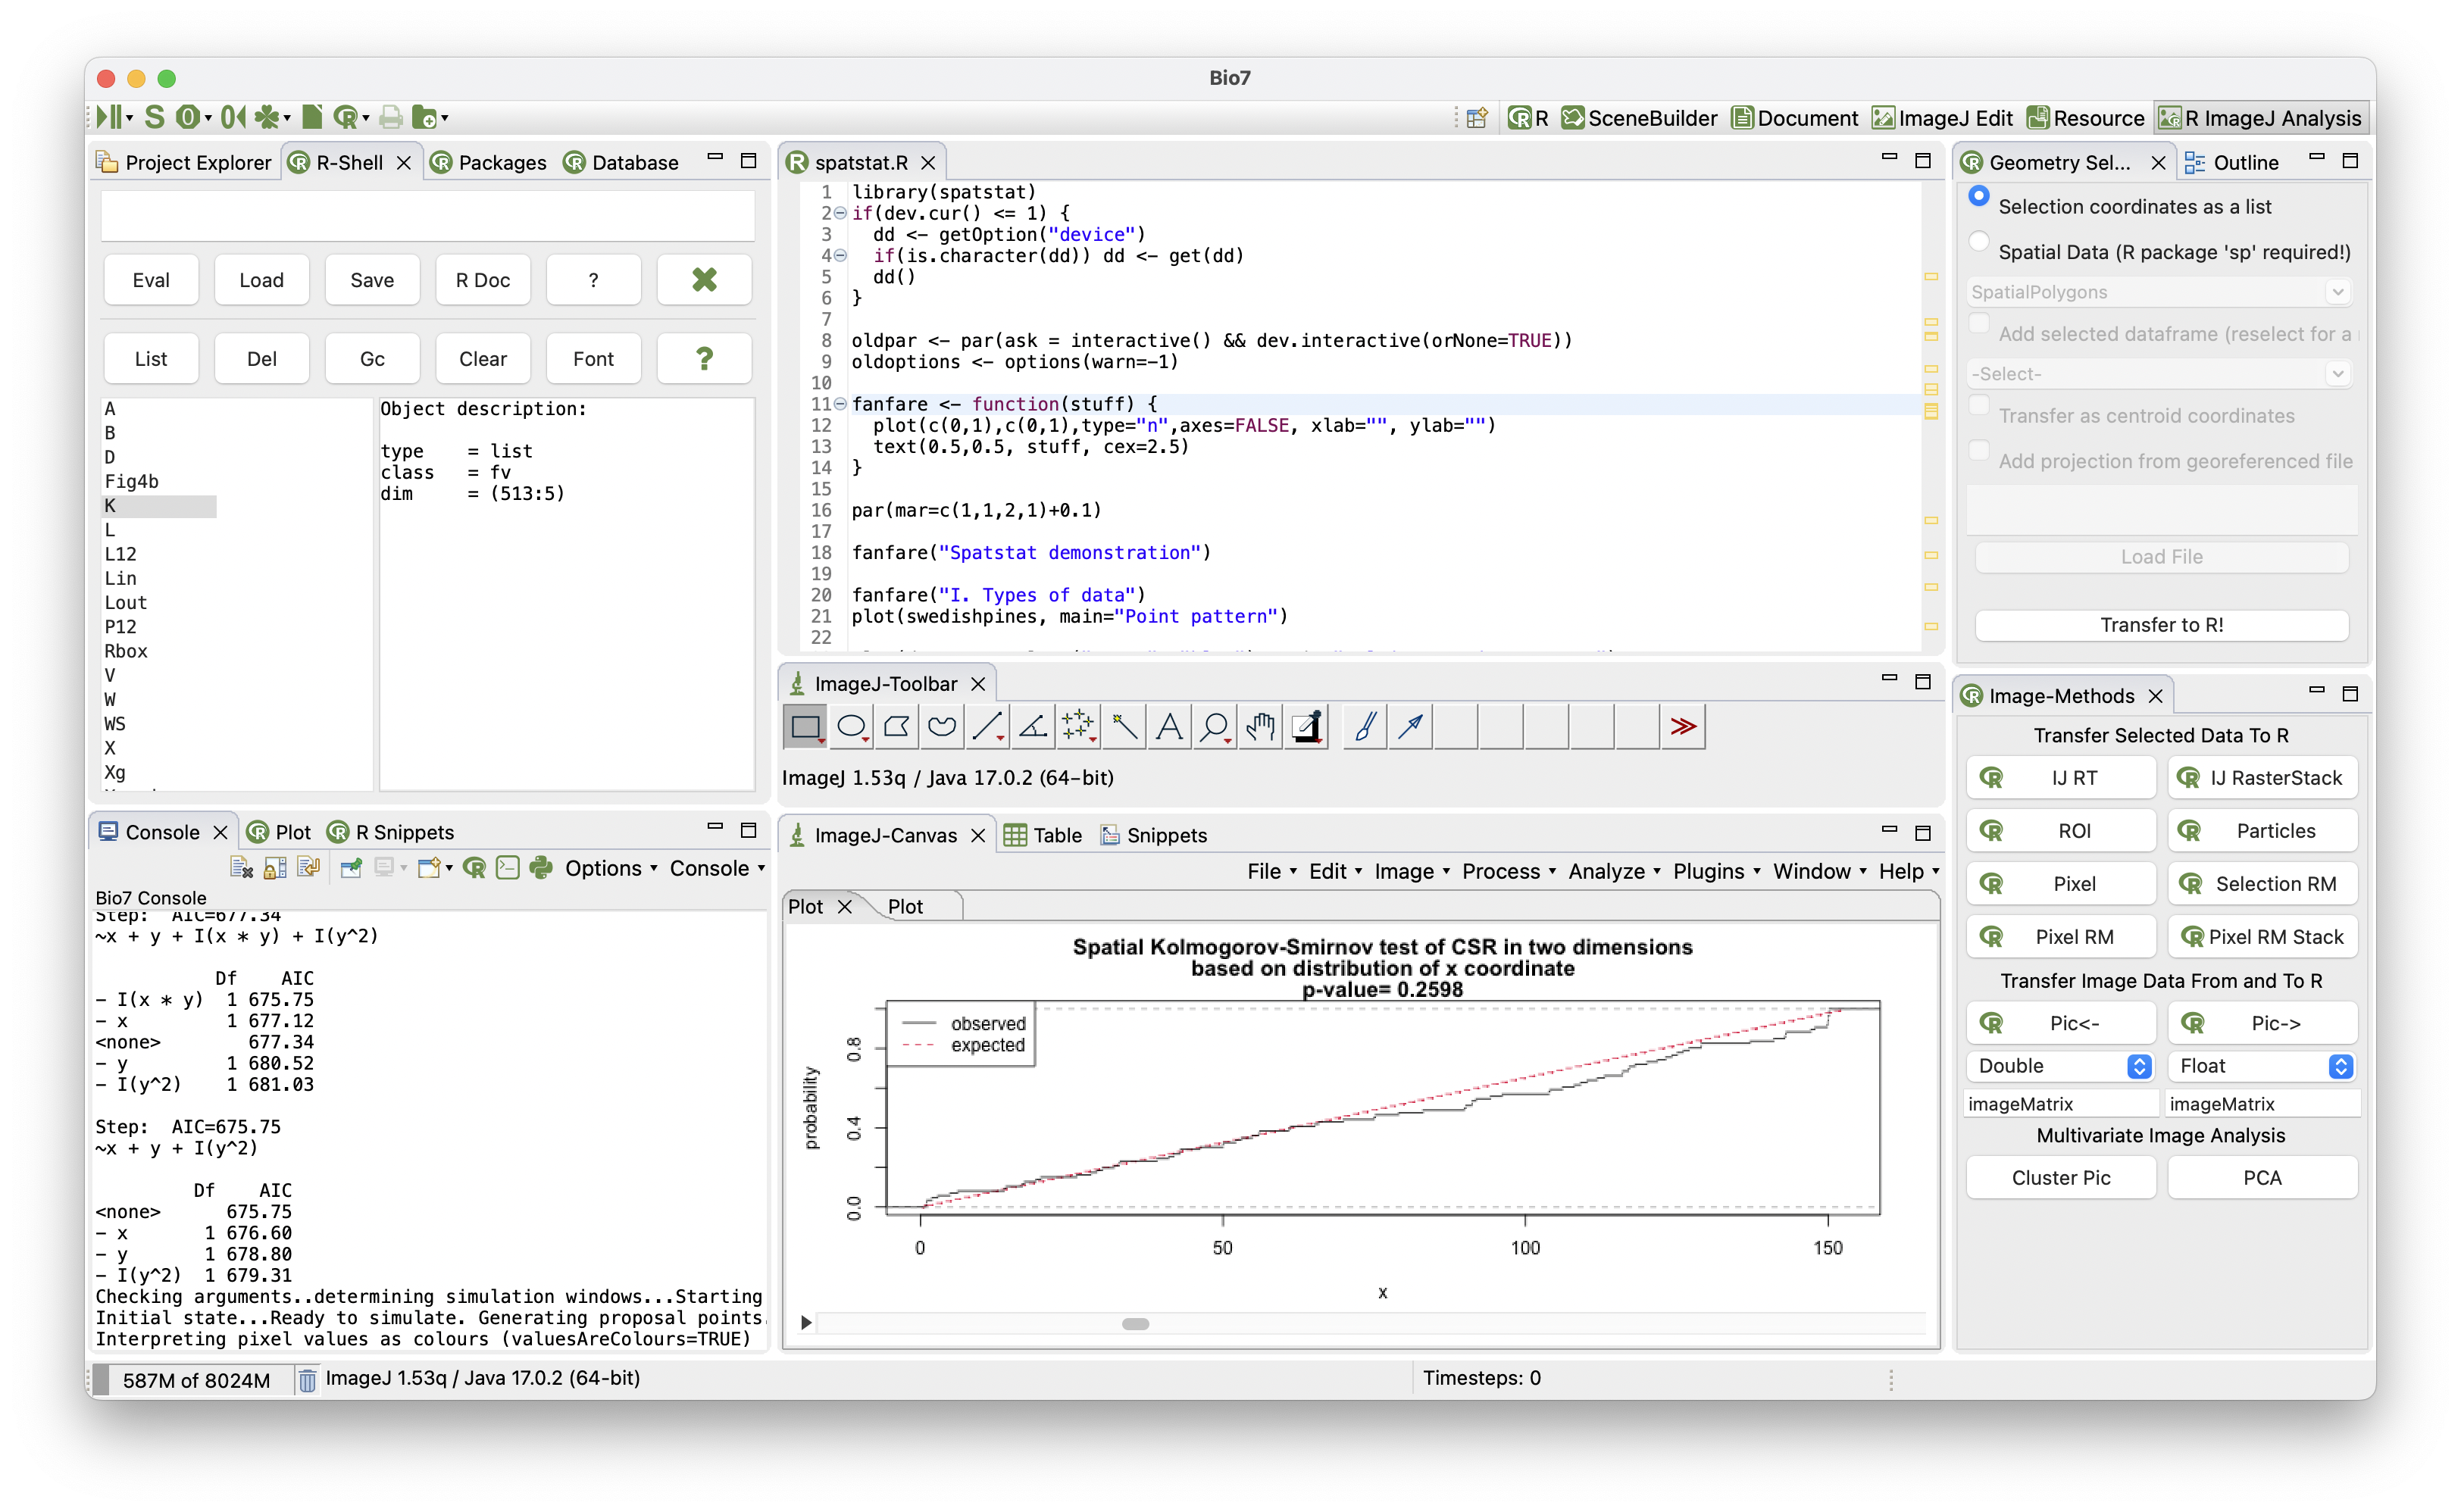
01.04.2022 A new version of Bio7 is available. The application Bio7 is a free and open-source integrated development environment for ecological modeling, scientific image analysis and statistical analysis.   Bio7 3.4 Release Notes General Bio7 3.4 based on Eclipse RCP 4.23 Bundled with Adoptium JDK 17 MacOSX M1 built available (64-bit) Improved dark theme (e.g., ... ...
[Read more...]

What is a horizon chart?

March 30, 2022 | kjytay

A horizon chart is a compact version of an area chart. In the words of Jonathan Schwabish (Reference 1, page 164), it is … an area chart that is sliced into equal horizontal intervals and collapsed down into single bands, … Continue reading →
[Read more...]

Underrated CRAN Packages

March 30, 2022 | R on The Data Sandbox

I sit here looking for inspiration, nothing interesting to write about. Perhaps there are some popular R packages on CRAN that I don’t know about? You can explore the data on downloads from CRAN with the cranlogs package. Top CRAN downloads With the...
[Read more...]

New R package yfR

March 30, 2022 | R | msperlin

Package BatchGetSymbols facilitates importation of Yahoo Finance data directly into R and is one of my most popular R packages, with over 100k installations since conception (around 2500 downloads per month). However, I developed BatchGetSymbols back in 2016, with many bad structural choices from my part. For years I wanted to improved ... [Read more...]

How I analyze 100+ ggplots at once

March 30, 2022 | Business Science

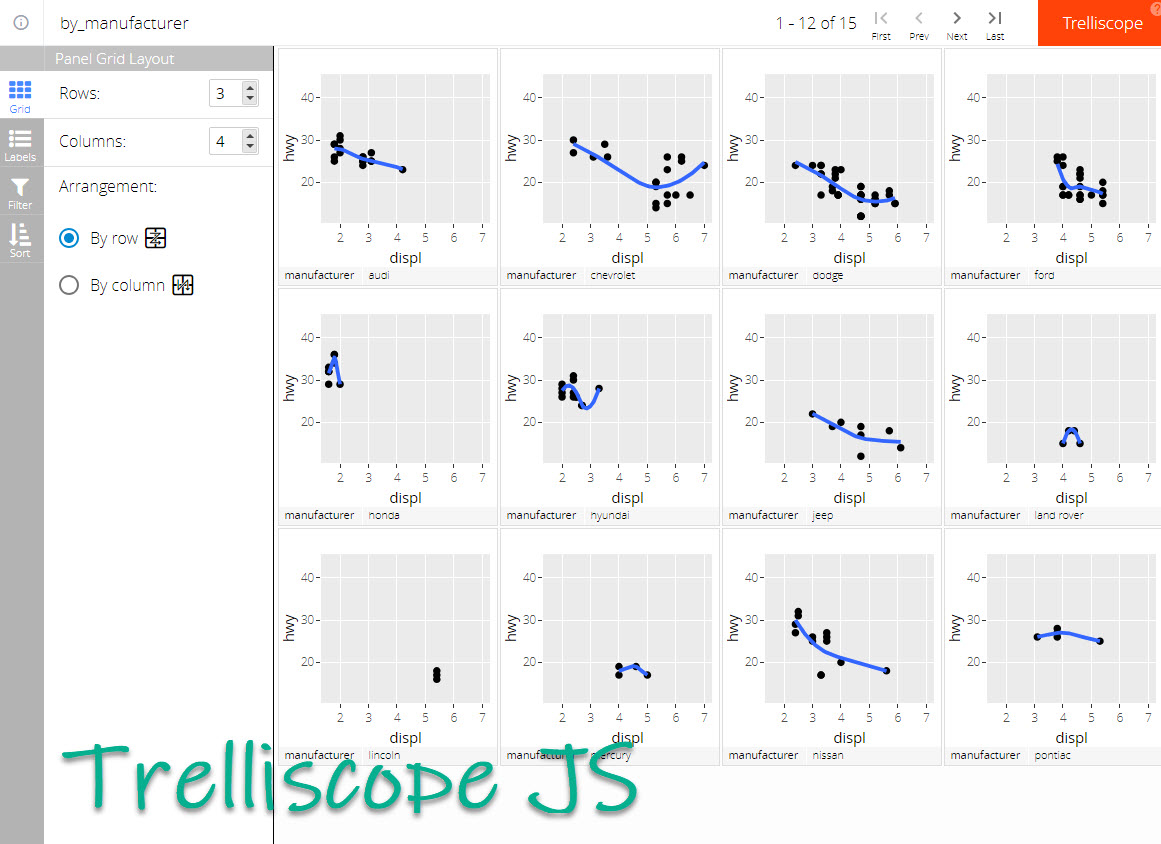
Visualizing big data is next to impossible. As soon as I have 12 plots, that’s where my ability to use native ggplot suffers. That is until I found trelliscopejs. trelliscopejs is like ggplot2 faceting on steroids. This may seem crazy, but the benefit...
[Read more...]

R Shiny in Life Sciences – Top 7 Dashboard Examples

March 29, 2022 | Dario Radečić

Today we bring you 7 dashboard examples of R Shiny in life sciences. R Shiny is one of the easiest ways for developers to make production-ready dashboards when speed and functionality are crucial. Shiny is approachable with a lot of documentation available, and because of this, a lot of developers/researchers ...
[Read more...]

Recreating the Storytelling with Data look with ggplot

March 28, 2022 | Albert Rapp

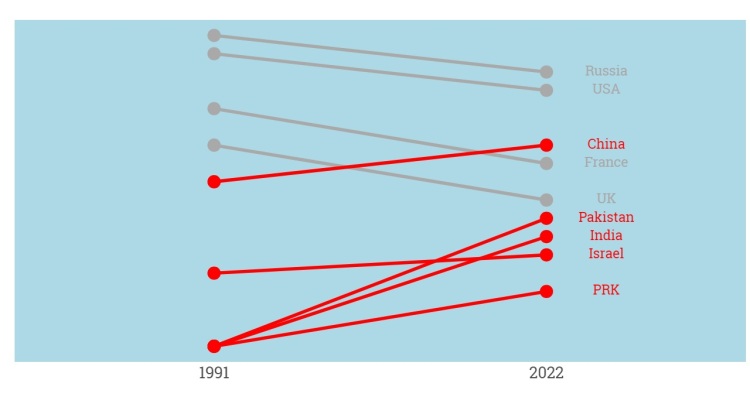
So, I found a great video from Storytelling with Data (SWD). In this video, a data storyteller demonstrates how a dataviz that does not demonstrate a clear story can be improved. Let’s take a look at the dataviz but, first, here’s the data.
<span class="lnt"> 1
</span><span class="lnt"> 2
</span><span class="lnt"> 3
</span><span class="lnt"> 4
</span><span class="lnt"> 5
</span><span class="lnt"> 6
</span><span class="lnt"> 7
</span><span class="lnt"> 8
</span><span class="lnt"> 9
</span><span class="lnt">10
</span><span class="lnt">11
</span><span class="lnt">12
</span><span class="lnt">13
</span><span class="lnt">14
</span><span class="lnt">15
</span><span class="lnt">16
</span><span class="lnt">17
</span><span class="lnt">18
</span><span class="lnt">19
</span><span class="lnt">20
</span><span class="lnt">21
</span><span class="lnt">22
</span><span class="lnt">23
</span><span class="lnt">24
</span><span class="lnt">25
</span><span class="lnt">26
</span><span class="lnt">27
</span><span class="lnt">28
</span><span class="lnt">29
</span><span class="lnt">30
</span><span class="lnt">31
</span><span class="lnt">32
</span>
library(tidyverse) dat % mutate(...
[Read more...]

How to download Kobotoolbox data in R

March 28, 2022 | R on Asitav Sen

Kobotoolbox is a popular tool or platform used by Non-profit organizations across the globe to collect data. Using a R package it is now possible, with convenience, to download data from Kobotoolbox to R. Kobotoolbox Kobotoolbox is perhaps the most widely used data collection tool used by non-profit organizations across ... [Read more...]
1 11 12 13 14 15 37