RObservations #44: Adding Frame and Custom Title Support To mapBliss
Want to share your content on R-bloggers? click here if you have a blog, or here if you don't.

Introduction
The mapBliss package is a R package which I developed which allows for users to make custom souvenir quality maps of their flights, road trips and favorite cities by utilizing the power of the leaflet and other R packages (for a full list, see the Github README here). The goal of the package is to imitate the visualization and print-ability of maps produced by businesses like Atlas.co(my original inspiration), TheLittlePen, Mapiful and MaptracksMe (among many other such businesses).
To get caught up on how this package came to be check out the earlier blogs:
- I reverse-engineered Atlas.co (well, some of it)
- Using the MapBox API with Leaflet
- Plotting Flight Paths on Leaflet Maps
- Packaging My Route Map Code! Introducing
mapBliss - Control Individual Label Positions In
mapBlissWith_flex()Functions
In this blog I share the newest feature in the mapBliss package- frame and custom title support along with the ability to save framed maps as a .svg file for a print quality visuals.
Introducing frame_1() and save_map_svg()
Thanks to the folks at StackOverflow, I was able to figure out how create custom frame and title support. I initially looked into adding a title only, but quickly realized that I needed to incorperate a frame to get to get the desired functionality. This combined with my own trial and error allowed me to come up with the frame_1() and save_map_svg() functions. frame_1() is called such in hope that there will be more custom frames designed along the way (please feel free to add potential designs or share your solutions to on the Github Issues), but for now, there is currently only a standard white frame for maps created.
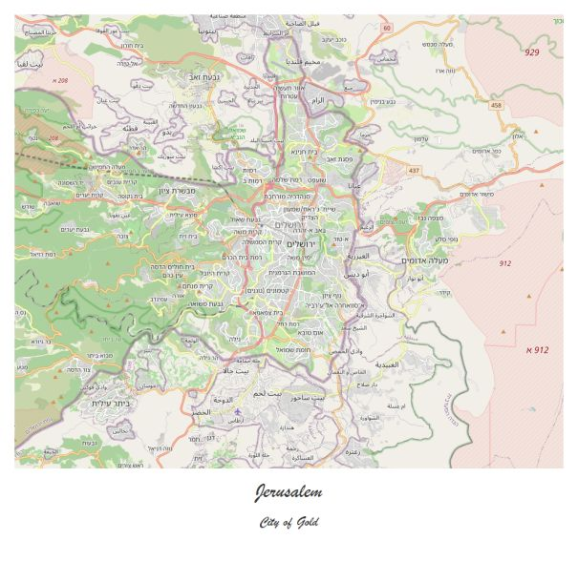
To preview your map you can just plot a map for your choosing and pipe it to the frame_1() function and add the relevant arguments.
(Since I’m blogging off of WordPress, I posted an image of the result below)
# devtools::install_github("benyamindsmith/mapBliss")
library(mapBliss)
map<-plot_city_view("Jersalem, IL") |>
     frame_1(title_text="Jerusalem",
             subtitle_text="City of Gold",
             subtitle_font="Brush Script MT")

map

If you want to save your map, you can use the save_map_frame_svg() function.
map |>
  save_map_frame_svg("myTestMap.svg")


Listening on http://127.0.0.1:7825
[1] "myTestMap.svg written in F:/"
And that’s pretty much it! With 3 functions its now possible to make a high quality, print ready “framed” and annotated map!
Next Steps/Conclusion
This is a pretty cool breakthrough in the overall progress of mapBliss. Some more ideas where this package can be improved would be with:
- Creating more frames with CSS to have more framing options– if you know of any CSS codes for making nice frames please let me know!
- Build a GUI…eventually…and work on all sorts of things to make that happen. Likely the GUI would be developed in
shiny.
Right now I don’t really have a particular timeline for getting any of this done, but its some of the ideas that I have in mind for further development of the mapBliss package.
I really want to get more people to play around with this package and see what they make with it! If you notice any problems or want a new feature, feel free to open an issue on Github and let me know!
Thank you for reading!

Want to see more of my content?
Be sure to subscribe and never miss an update!
R-bloggers.com offers daily e-mail updates about R news and tutorials about learning R and many other topics. Click here if you're looking to post or find an R/data-science job.
Want to share your content on R-bloggers? click here if you have a blog, or here if you don't.
