Want to share your content on R-bloggers? click here if you have a blog, or here if you don't.

Introduction
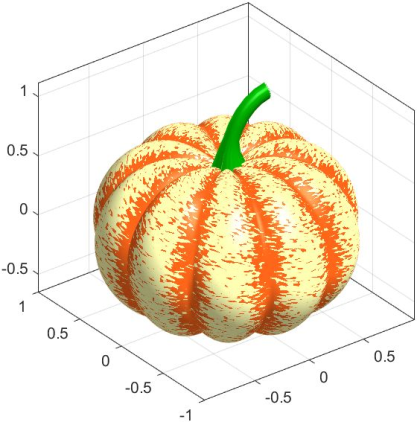
A while back I saw the Mathworks LinkedIn page make a post on how it is possible to make a Pumkin and other autumn gourds with Matlab code (for a more complete list of how to make other autumn Gourds in Matlab, check out Eric Ludlam’s Github repository).
Seeing this inspired me to give it a shot in R and explore using 3D graphics with a playful example. In this short blog I share my attempt with how to make the a 3D pumpkin in R using the pracma and rgl libraries.
Matlab Code
The Matlab Code which was posted by Mathworks is:
% Pumpkin
[X,Y,Z]=sphere(200);
R=1-(1-mod(0:.1:20,2)).^2/12;
x=R.*X; y=R.*Y; z=Z.*R;
c=hypot(hypot(x,y),z)+randn(201)*.03;
surf(x,y,(.8+(0-(1:-.01:-1)'.^4)*.3).*z,c, 'FaceColor', 'interp', 'EdgeColor', 'none')
% Stem
s = [ 1.5 1 repelem(.7, 6) ] .* [ repmat([.1 .06],1,10) .1 ]';
[t, p] = meshgrid(0:pi/15:pi/2,0:pi/20:pi);
Xs = -(.4-cos(p).*s).*cos(t)+.4;
Zs = (.5-cos(p).*s).*sin(t) + .55;
Ys = -sin(p).*s;
surface(Xs,Ys,Zs,[],'FaceColor', '#008000','EdgeColor','none');
% Style
colormap([1 .4 .1; 1 1 .7])
axis equal
box on
material([.6 1 .3])
lighting g
camlight
This produces the following image:

The challenge for figuring out whats happening here lies in the Matlab syntax. I haven’t touched Matlab much since my first semester of undergrad. This and not not having access to a Matlab licence made it led me to figure things out from reading the Matlab docs and debugging in Octave – a Matlab compatible language.
Doing it in R
When I was first looked at the code, I thought it would be straight forward enough. However I was quick to learn that a 1-to-1 translation needed more effort than initially expected. For one, a function similar to the Matlab’s sphere function was not readily available in R or any of the libraries I looked into. I managed to figure that out by enlisting the help of Stack Overflow. However, even with the sphere function taken care of, I still wasn’t able to get it right. This time, I asked StackOverflow to basically do the work for me. But even with this, I only managed to get a partial answer for the shape of the pumpkin sans stem:
library(pracma)
library(rgl)

# 3D sphere function
sphere <- function(n) {
  dd <- expand.grid(theta = seq(0, 2*pi, length.out = n+1),
                    phi = seq(-pi, pi, length.out = n+1))
  with(dd,
       list(x = matrix(cos(phi) * cos(theta), n+1),
            y = matrix(cos(phi) * sin(theta), n+1),
            z = matrix(sin(phi), n+1))
  )
}

# Pumpkin Code
sph <- sphere(200)
X <- sph[[1]]
Y <- sph[[2]]
Z <- sph[[3]]

# scaling
R <- 1 - (1 - seq(from=0, to=20, by=0.1) %% 2) ^ 2 / 12 # function
R2 <- 0.8 - Z[1,]^4 * 0.2

x <- R * X # scale rows for wavy side
y <- R * Y # scale rows for wavy side
z <- t(R2 * t(Z)) # scale columns by transpose for flat oval shape

# color according to distance to [0,0,0]
hypot_3d <- function(x, y, z) {
  return(sqrt(x^2 + y^2 + z^2))
}
c_ <- hypot_3d(x,y,z) + rnorm(201) * 0.03
color_palette <- terrain.colors(20) # color look-up table
col <- color_palette[ as.numeric(cut(c_, breaks = 20)) ] # assign color to 20 levels of c_


persp3d(x, y, z, color = col, aspect=FALSE,xlab="", ylab="", zlab="")
For the stem, I had to go at it myself. After much debugging in Octave, I managed to figure out how to replicate the required matrix operations. What’s interesting is that in the original Matlab code, only half of the stem is plotted. To make a full stem, the stem needs to be plotted twice with the second plot of the stem having the negative of the Y matrix:
# Code for Stem

s <- c(1.5, 1, rep(0.7,6)) %*% t(c(rep(c(0.1,0.06),10),0.1))
mesh <- meshgrid(x=seq(from=0,to=pi/2,by=pi/15),y=seq(from=0,to=pi,by=pi/20))
tt<- mesh[[1]]
p <- mesh[[2]]
Xs<- -(0.4-cos(p)*t(s))*cos(tt)+0.4
Zs <- (0.5-cos(p)*t(s))*sin(tt) + 0.55
Ys <-  -sin(p)*t(s)
color_palette_2 <- hcl.colors(20,palette = "Purple-Brown")
col2 <- color_palette_2[ as.numeric(cut(c_, breaks = 20)) ] # assign color to 20 levels of c_

# Pumpkin
persp3d(x, y, z, color = col, aspect=FALSE,xlab="", ylab="", zlab="")

# Stem (Both sides)
surface3d(Xs,Ys,Zs,color=col2)
surface3d(Xs,-Ys,Zs,color=col2)
And there you have it! A “Matlab pumpkin” in R!
Conclusion
It was definitely interesting working on this! After finishing this blog, I learned that it is possible to use modern libraries (like plotly and rayshader) to get a nicer visual, so this blog is just one of the ways that you can make 3D graphics in R.
If you have another way of making a “Matlab Pumpkin” in R which looks better or more interesting please feel free to share your code in the comments!
Thank you for reading!
R-bloggers.com offers daily e-mail updates about R news and tutorials about learning R and many other topics. Click here if you're looking to post or find an R/data-science job.
Want to share your content on R-bloggers? click here if you have a blog, or here if you don't.
