2022

Subset rows based on their integer locations-slice in R

July 14, 2022 | Jim

The post Subset rows based on their integer locations-slice in R appeared first on Data Science Tutorials Subset rows based on their integer locations, R has the slice() function, which allows you to subset rows according to their integer places. Statistical test assumptions and requirements – Data Science Tutorials The following ... [Read more...]

Eight R Tidyverse tips for everyday data engineering

July 14, 2022 | tomaztsql

Tidyverse is a collection of R packages, primarily for data engineering and analytics. These packages are ggplot2, purrr, tibble, dplyr, tidyr, stringr, readr, and forcats. And all combine the same language, design and “grammar” structures. 1. Use pipe “%__%” for…Read more ›
[Read more...]

How to do Conditional Mutate in R?

July 13, 2022 | Jim

The post How to do Conditional Mutate in R? appeared first on Data Science Tutorials How to do Conditional Mutate in R, It’s common to wish to add a new variable based on a condition to an existing data frame. The mutate() and case when() functions from the dplyr ... [Read more...]

simulating from the joint cdf

July 12, 2022 | xi'an

An X validated question (what else?!) brought back (to me) the question of handling a bivariate cdf for simulation purposes. In the specific case of a copula when thus marginals were (well-)known…. And led me to an erroneous chain of thought, fortunately rescued by Robin Ryder! When the marginal ...
[Read more...]

How to plot Bump Chart in R?

July 12, 2022 | finnstats

The post How to plot Bump Chart in R? appeared first on finnstats. How to plot Bump Chart in R?, A bump chart is a sort of chart that emphasizes the order of the groups rather than the quantity of change by displaying rankings of various groups... If you are ...
[Read more...]

Random Forest Machine Learning Introduction

July 12, 2022 | Jim

The post Random Forest Machine Learning Introduction appeared first on Data Science Tutorials Random Forest Machine Learning, We frequently utilize non-linear approaches to represent the link between a collection of predictor factors and a response variable when the relationship between them is extremely complex. Classification and regression trees, often known ... [Read more...]

Network Graphs in R

July 11, 2022 | Mark Edney

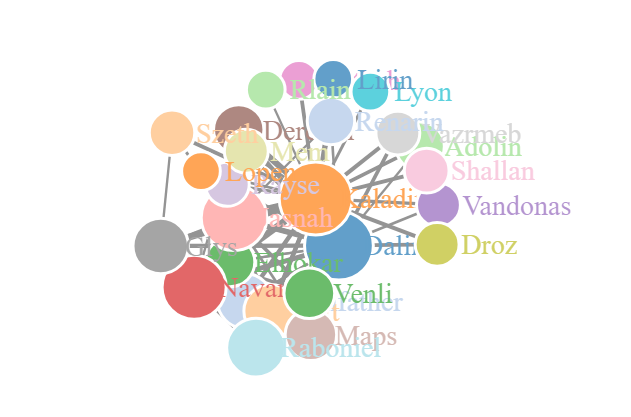
Introduction Network graphs are an important tool for network analysis. They illustrate points, referred to as nodes, with connecting lines, referred to as edges. Since network graphs are such useful tools, there are many options for graph generation. In this posting, I will demonstrate three different techniques for developing network ...
[Read more...]

Network Graphs in R

July 11, 2022 | R on The Data Sandbox

Introduction Network graphs are an important tool for network analysis. They illustrate points, referred to as nodes, with connecting lines, referred to as edges. Since network graphs are such useful tools, there are many options for graph generation. In this posting, I will demonstrate three different techniques for developing network ...
[Read more...]

R is for actuaRies

July 11, 2022 | R Views

Dr Maria Prokofieva is a member of the R / Business working group which is promoting the use of R in accounting, auditing, and actuarial work. She is also a professor at the Victoria University Business School in Australia and works with ...
[Read more...]

How to Use Mutate function in R

July 11, 2022 | Jim

The post How to Use Mutate function in R appeared first on Data Science Tutorials How to Use Mutate function in R, This article demonstrates how to add additional variables to a data frame using R’s mutate() function. Artificial Intelligence Examples-Quick View – Data Science Tutorials How to Use Mutate ... [Read more...]
1 43 44 45 46 47 100

Never miss an update!
Subscribe to R-bloggers to receive
e-mails with the latest R posts.
(You will not see this message again.)

Click here to close (This popup will not appear again)