Advent of 2021, Day 7 – Starting Spark with R and Python
Want to share your content on R-bloggers? click here if you have a blog, or here if you don't.
Series of Apache Spark posts:
- Dec 01: What is Apache Spark
- Dec 02: Installing Apache Spark
- Dec 03: Getting around CLI and WEB UI in Apache Spark
- Dec 04: Spark Architecture – Local and cluster mode
- Dec 05: Setting up Spark Cluster
- Dec 06: Setting up IDE
Let’s look into the local use of Spark. For R language, sparklyr package is availble and for Python pyspark is availble.
Starting Spark with R
Starting RStudio and install the local Spark for R. And Java 8/11 must also be available in order to run Spark for R.
Install the needed packages and install the desired Spark version:
install.packages("sparklyr")
spark_install(version = "2.1")

library(sparklyr)
sc <- spark_connect(master = "local", version = "2.1.0")
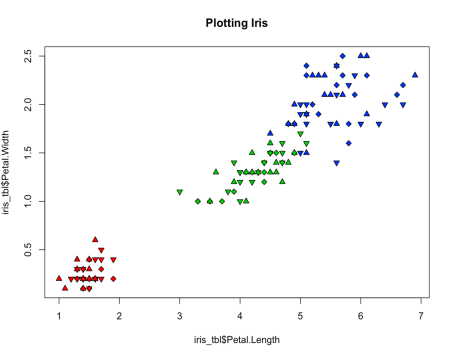
Once the Spark_connect is created, we can start using the connector for data transformation and data analysis. A simple call for Iris dataset and plotting the data:
iris_tbl <- copy_to(sc, iris)
plot(iris_tbl$Petal.Length, iris_tbl$Petal.Width, pch=c(23,24,25), bg=c("red","green3","blue")[unclass(iris_tbl$Species)], main="Plotting Iris")
And at the end, close the connection:
spark_disconnect(sc)
When using sparklyr, there are no limitation to which cluster and server you can connect. Connecting to local or to cluster mode, both are acceptable. There should only be Java and Spark installed.
Starting Spark with Python
Start your favourite Python IDE. In my case PCharm and in this case, I will use already installed Spark engine and connect to it using Python.
import findspark
findspark.init("/opt/spark")
from pyspark import SparkContext
With using pyspark, we will connect to standalone local mode, that can be execute by using (in folder: /usr/local/Cellar/apache-spark/3.2.0/libexec/sbin):
start-master.sh --master local
And the context can now be used with: spark://tomazs-MacBook-Air.local:7077
sc = SparkContext('spark://tomazs-MacBook-Air.local:7077', 'MyFirstSparkApp')
And we can import some csv data, create a spark session and start working with the dataset.
data=spark.read.format("csv") \
    .option("header","true") \
    .option("mode","DROPMALFORMED") \
    .load('/users/tomazkastrun/desktop/iris.csv')
And simply create a plot:
import seaborn as sns
sns.set_style("whitegrid")
sns.FacetGrid(data, hue ="species",height = 6).map(plt.scatter,'sepal_length', 'petal_length').add_legend()
And get the result:
And again, close the spark context connection:
sc.stop()
Tomorrow we will start working with dataframes. 
Compete set of code, documents, notebooks, and all of the materials will be available at the Github repository: https://github.com/tomaztk/Spark-for-data-engineers
Happy Spark Advent of 2021! 
R-bloggers.com offers daily e-mail updates about R news and tutorials about learning R and many other topics. Click here if you're looking to post or find an R/data-science job.
Want to share your content on R-bloggers? click here if you have a blog, or here if you don't.


