October 2021
This is a guest post from Kathleen Bostic (Spelman College) and Michel Ruiz-Fuentes (Smith College), participants in the INSPIRE U2 summer site directed by Dr. A. Nayena Blankson. The INSPIRE U2 Program provides a learning pathway for underrepresented...
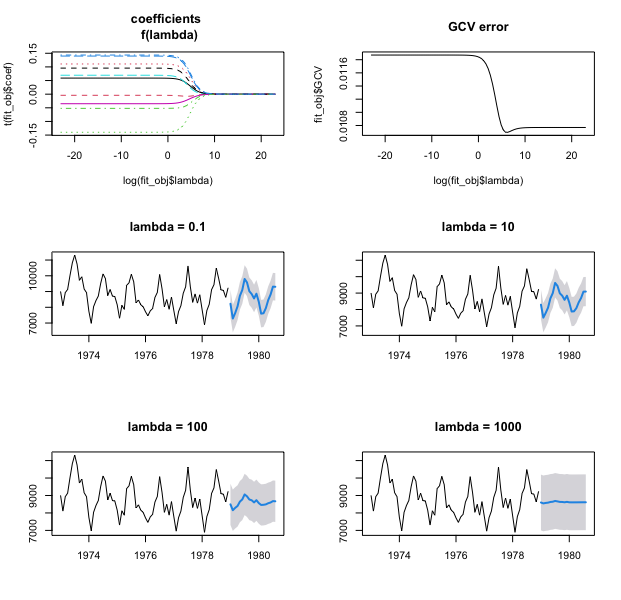
Automatic Forecasting with `ahead::dynrmf` and Ridge regression
Automatic univariate time series forecasting with `ahead::dynrmf` and Ridge regression.

Predict #TidyTuesday giant pumpkin weights with workflowsets
This is the latest in my series of
screencasts demonstrating how to use the
tidymodels packages. If you are a tidymodels user, either just starting out or someone who has used the packages a lot, we are interested in your feedback on
our priorities ...

rOpenSci News Digest, October 2021
Dear rOpenSci friends, it’s time for our monthly news roundup!
You can read this post on our blog.
Now let’s dive into the activity at and around rOpenSci!
rOpenSci HQ
Community call about the statistical software review project
A fant... [Read more...]
Excess Deaths in 2020
Prompted by a guest visit to Mine Çetinkaya-Rundel’s Advanced Data Visualization class here at Duke, I’ve updated my US and state excess death graphs. Earlier posts (like this one from February) will update as well.
I am interested in all-cause mortality in the United States for 2020. I look ...

Descriptive Statistics in R
Descriptive Statistics in R, You’ll learn about descriptive statistics in this tutorial, which is one strategy you might employ in exploratory data analysis.
Before you invest time constructing intricate models, it’s necessary to first ...
Descriptive Statistics in R
Descriptive Statistics in R, You’ll learn about descriptive statistics in this tutorial, which is one strategy you might employ in exploratory data analysis. Before you invest time constructing intricate models, it’s necessary to first...
The post Descriptive Statistics in R appeared first on finnstats.

Row-wise operations with the {tidyverse}
You can read the original post in its original format on Rtask website by ThinkR here: Row-wise operations with the {tidyverse}
We are often asked how to perform row-wise operations in a data.frame (or a tibble) the answer is, as usual, “it depends” ? Let’s look at some cases ... [Read more...]
Embedding Shiny Apps in Tableau Dashboards Using shinytableau
Screenshot of a Tableau dashboard with a shinytableau extension
At RStudio, we strive to help you combine the power of code-first data science with the other tools in your toolkit. Many organizations rely on Tableau for creating data dashboards, but ...

NIMBLE online tutorial, November 18, 2021
We’ll be giving a two-hour tutorial on NIMBLE, sponsored by the environmental Bayes (enviBayes) section of ISBA (The International Society for Bayesian Analysis), on Thursday November 18, from 11 am to 1 pm US Eastern time. NIMBLE (r-nimble.org) is a system for fitting and programming with hierarchical models in R that ...
A new function to plot convergence diagnostics from lme4::allFit()
Linear mixed-effects models (LMM) offer a consistent way of performing regression and analysis of variance tests which allows accounting for non-independence in the data. Over the past decades, LMMs have subsumed most of the General Linear Model, with a stead increase in popularity (Meteyard & Davies, 2020). Since their conception, LMMs have ...

How to do Data Format in R
Data Format in R, You’ll learn about data formats and why reformatting data can help you enhance your data analysis in this tutorial.
Data is typically acquired from a variety of sources and by a variety of persons, and it is kept in a variet...
How to do Data Format in R
Data Format in R, You’ll learn about data formats and why reformatting data can help you enhance your data analysis in this tutorial. Data is typically acquired from a variety of sources and by...
The post How to do Data Format in R appeared first on finnstats.

Visually assessing the parallel trends assumption for DID estimation with control variables
Difference-in-Difference (DID) estimation is a very intuitive and popular approach to estimate causal effects (see here for my take on teaching it). If you know about DID and want to directly know how to create a plot to assess the parallel trends assu... [Read more...]
A closer look at vaccination breakthroughs in Switzerland
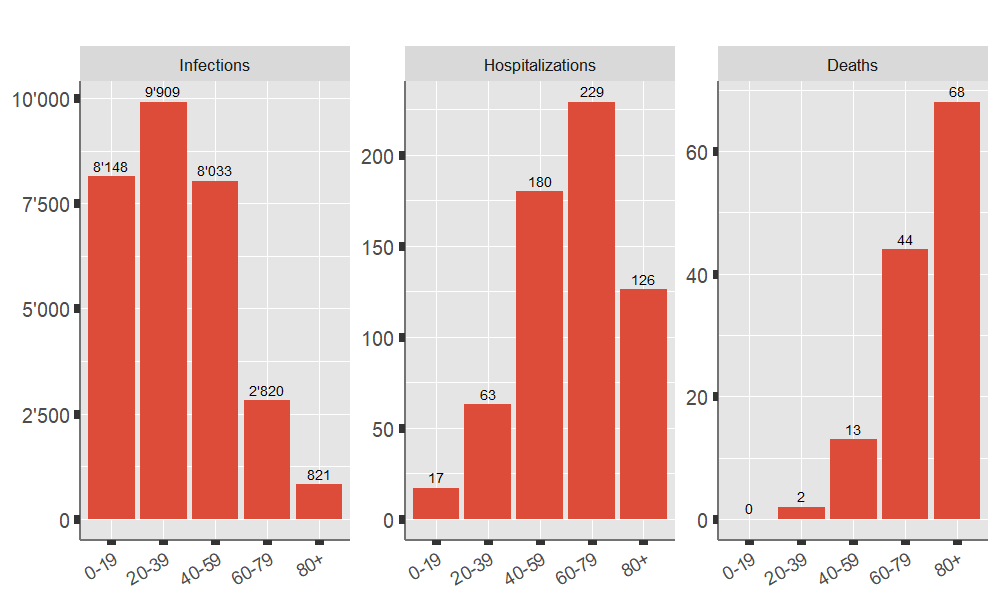
Our Covid19 app provides global view of the pandemic, but how effective is the vaccination in Switzerland?
Since May 2020 we are showing on our gallery a dashboard with a global view of the COVID-19 Pandemic, including a split by continent and count...

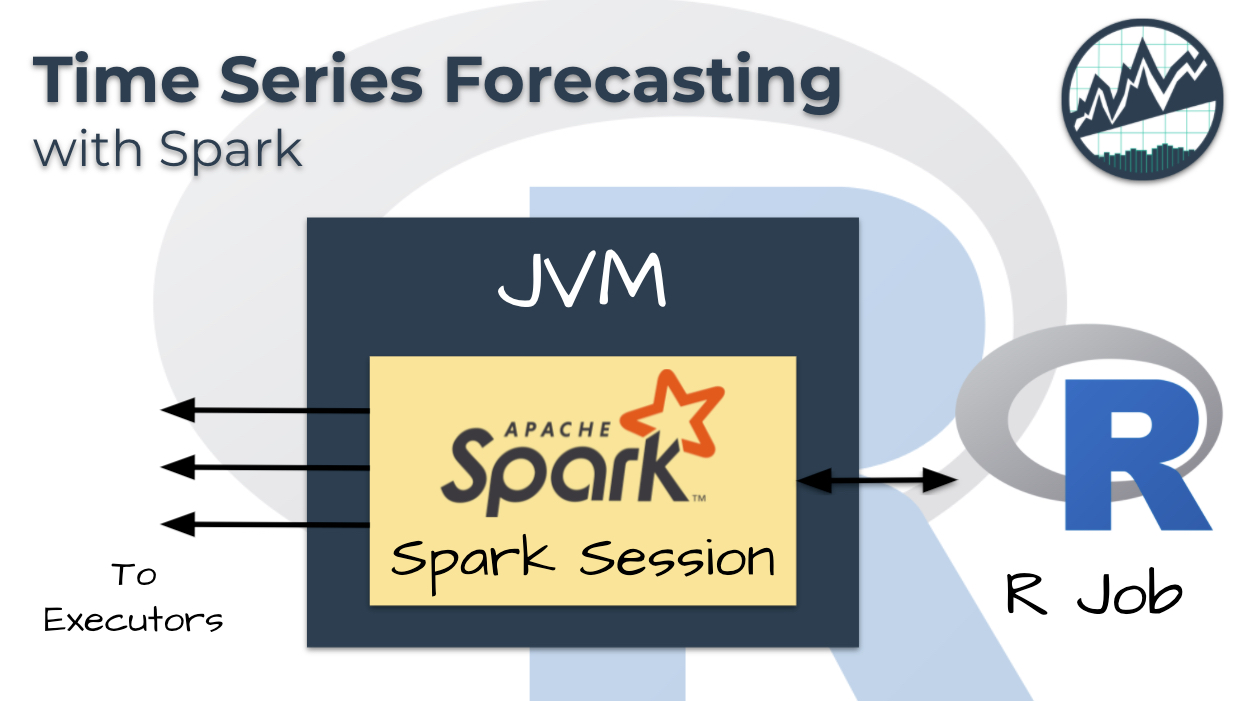
Tidy Time Series Forecasting in R with Spark
I’m SUPER EXCITED to show fellow time-series enthusiasts a new way that we can scale time series analysis using an amazing technology called Spark!
Without Spark, large-scale forecasting projects of 10,000 time series can take days to run because of long-running for-loops and the need to test many models on ...

The INSPIRE U2 Program: Training Students in Big Data and Statistics Using RStudio
Logos of the National Science Foundation, Spelman College, and RStudio
This is a guest post from Dr. A. Nayena Blankson, Professor of Psychology at Spelman College. Dr. Blankson is the Director of the INSPIRE U2 summer site (NSF Award #1852056), as ... [Read more...]
A beginner’s guide to Shiny modules
This post by Emily Riederer is the winning entry in our recent Call for Documentation contest. Emily is a Senior Analytics Manager at Capital One where she leads a team building internal analytical tools including R packages, datamarts, and Shiny apps. Outside of work, Emily can be found sharing more ...
Pass parameter to SQL Server DATEADD function using R
I wanted to try and create some parameters in my flexdashboard script, so I could extract data from our warehouse over a flexible date range.
In SQL Server, I’d create a variable and reference it like this:
DECLARE @ndays int
SET @ndays = -... [Read more...]
Pass parameter to SQL Server DATEADD function using R
I wanted to try and create some parameters in my flexdashboard script, so I could extract data from our warehouse over a flexible date range. [Read more...]
Copyright © 2022 | MH Corporate basic by MH Themes