September 2021
Week 2 Gold Mining and Fantasy Football Projection Roundup now available.
The post Gold-Mining Week 2 (2021) appeared first on Fantasy Football Analytics.
[Read more...]
Ogive curve in R
Ogive curve in R, It is a graph plotted for the variate values and their corresponding cumulative frequencies of a frequency distribution.
The sum of all preceding frequencies up to this point is referred to as cumulative frequency.
Its shape is...
Ogive curve in R
Ogive curve in R, It is a graph plotted for the variate values and their corresponding cumulative frequencies of a frequency distribution. The sum of all preceding frequencies up to this point is referred...
The post Ogive curve in R appeared first on finnstats.

Is the Stock Market Efficient? Let your ZIP Compression Tool give an Answer!
One of the most fiercely fought debates in quantitative finance is whether the stock market (or financial markets in general) is (are) efficient, i.e. whether you can find patterns in them that can be profitably used. If you want to learn about an ingenious method (that is already present ... [Read more...]
Nonlinear Market Forecasting using ‘Stealth Curves’
In 2001, I was fortunate to discover a ‘market characteristic’ that transcends virtually every liquid market. Markets often trend in a nonlinear fashion according to hidden support/resistance curves (Stealth Curves). Whereas ‘market anomalies’ are transient and are overwhelmingly market specific, Stealth Curves are highly robust across virtually every market and ...

Download recently published book – Learn Data Science with R
Learn Data Science with R is for learning the R language and data science. The book is beginner-friendly and easy to follow. It is available for download as a book giveaway offer for a limited period. The book topics are – R Language Data Wrangling with data.table package Graphing with ...

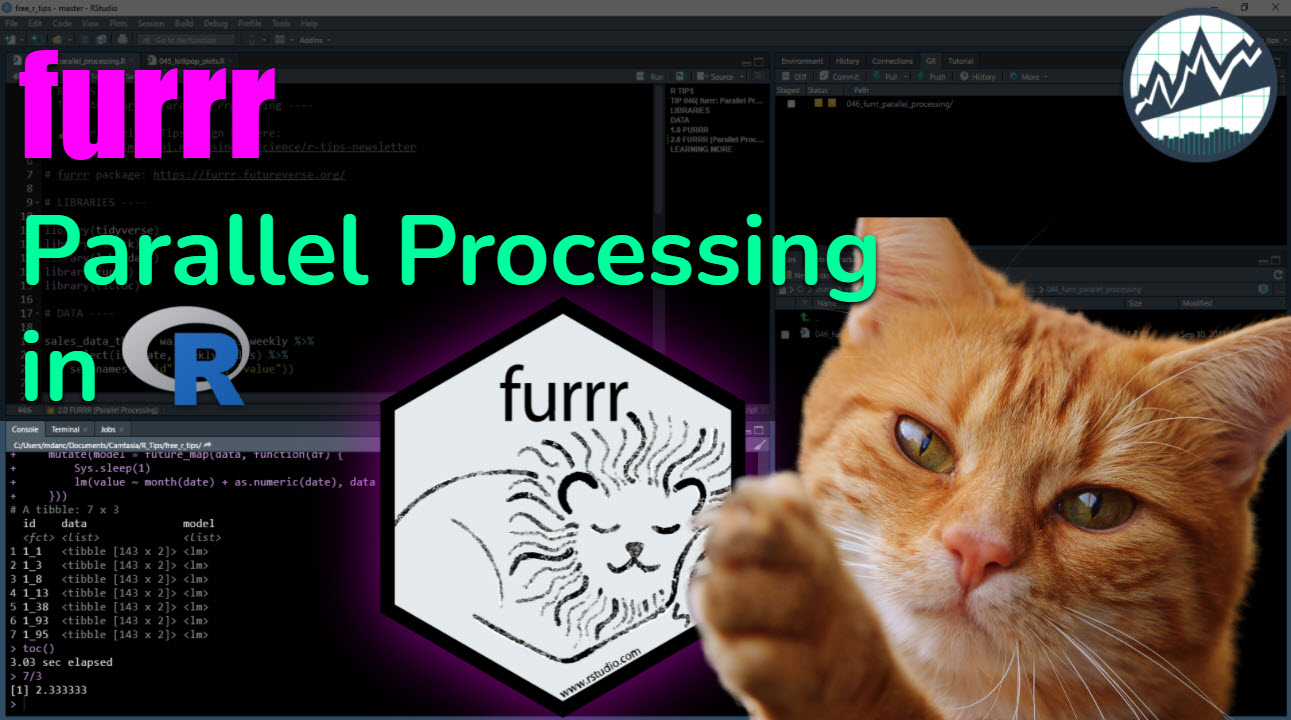
Tidy Parallel Processing in R with furrr
Parallel processing in the tidyverse couldn’t be easier with the furrr package. If you are familiar with the purrr::map() function, then you’ll love furrr::future_map(), which we’ll use in this FREE R-Tip training to get a 2.6X speed-up in our code.
R...

How do you use Shiny to communicate to 8 million people?
Full GA Tech Spotlight Video on YouTube
Data visualization is fundamentally an act of communication. While many discussions focus on the technical aspects of creating visualizations, communicating your insights in a clear, relevant and accessible way ... [Read more...]
Drawing the wrong conclusion about subgroups: a comparison of Bayes and frequentist methods
In the previous post, I simulated data from a hypothetical RCT that had heterogeneous treatment effects across subgroups defined by three covariates. I presented two Bayesian models, a strongly pooled model and an unpooled version, that could be us...

Little useless-useful R functions – Useless Year Progress bar with spinning cursor
Progress bar showing the number of days until end of the year. Yes, only based on the days and not hour. And needless to say, the progress is soothing using ASCII charts. So the function is fair to say, simple…Read more ›

Why I’m excited to join RStudio, told through a blogdown metadata project
I am excited to announce that I’ve joined the RStudio Marketing team! I will be creating content on the RStudio Blog that will announce news and share stories from the company, users, and partners. I just started this week and, ready to jump i...

Why I’m Excited to Join RStudio, Told Through a {blogdown} Metadata Project
I joined RStudio to contribute to their blog, and the first thing I did was use R to pull metadata from the blog.
[Read more...]
How to Use System Commands in your R Script or Package
Have you ever found a command-line tool that’s perfect for getting your job done, and wanted to use it from an R script or package?
E.g. some sort of scientific software providing a specific functionality made available though a command-line int... [Read more...]
Another 9 R books added to BigBookofR
The collection of R books at BigBookofR continues to grow! Thanks to @erictleaungu , @StanLazic, @rohmanoabdur, @preposterior, @lago67522285 and @lfvasconcelos_ for their contributions. Computing for the social sciences By Dr. Benjamin Soltoff The goal of this course is to teach you basic computational skills and provideyou with the means to …
The ... [Read more...]
Binomial Distribution in R-Quick Guide
Binomial Distribution in R, Binomial distribution was invented by James Bernoulli which was posthumously published in 1713.
Let n ( finite) Bernoulli trials be conducted with probability “p” of success and “q” of a failure.
The probability of x...
Binomial Distribution in R-Quick Guide
Binomial Distribution in R, Binomial distribution was invented by James Bernoulli which was posthumously published in 1713. Let n ( finite) Bernoulli trials be conducted with probability “p” of success and “q” of a...
The post Binomial Distribution in R-Quick Guide appeared first on finnstats.

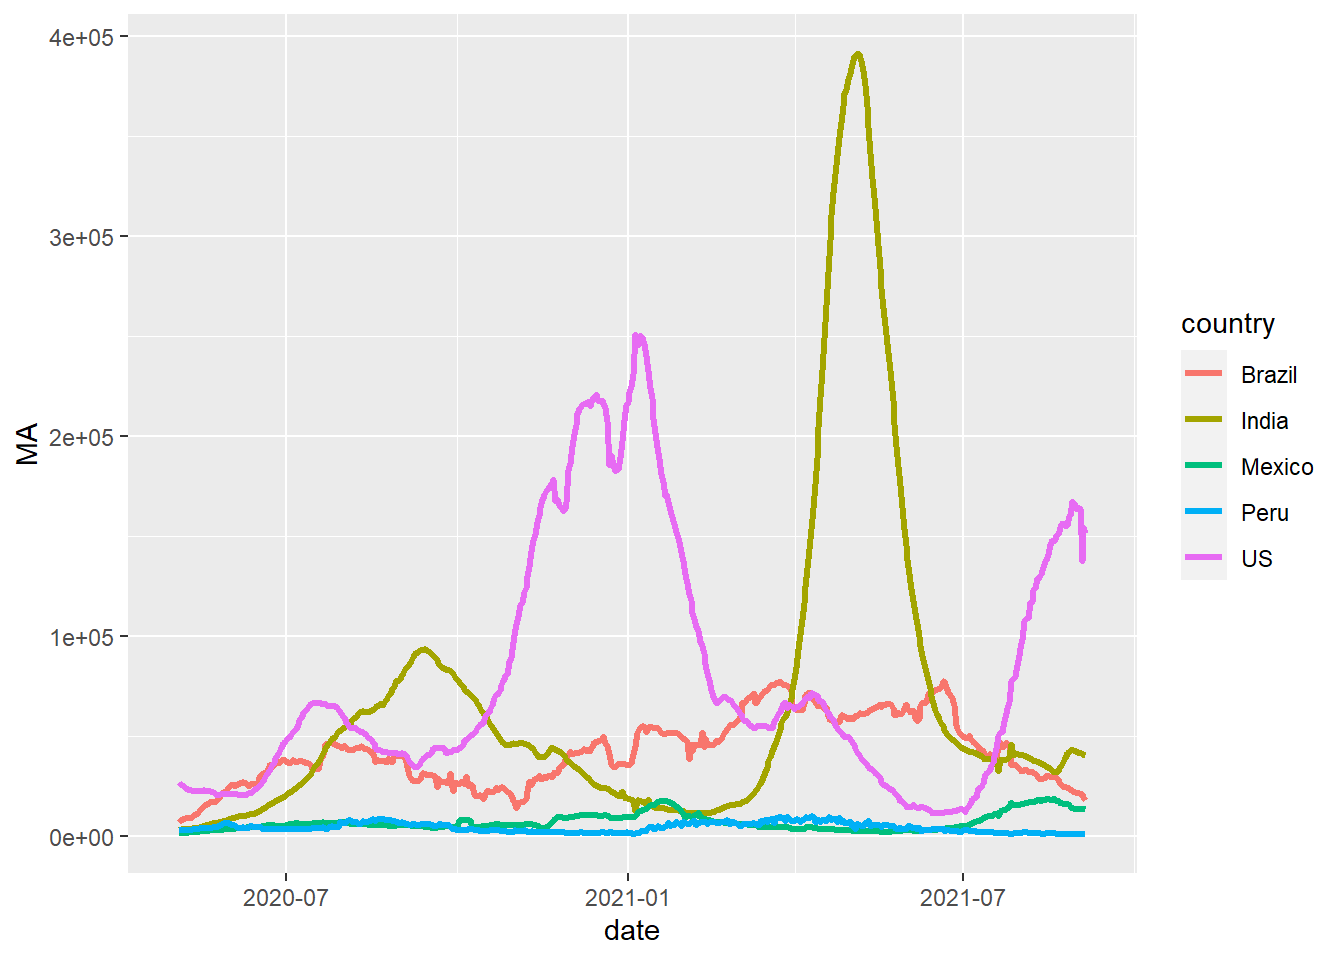
Visualising COVID data using R and leaflet
Leaflet is a JavaScript library for interactive maps. Leaflet for R is super easy to use and a great way to visualise data that has a spatial dimension. Below are some examples on how to use the leaflet package in R to visualise some COVID-19 data.
Pac... [Read more...]
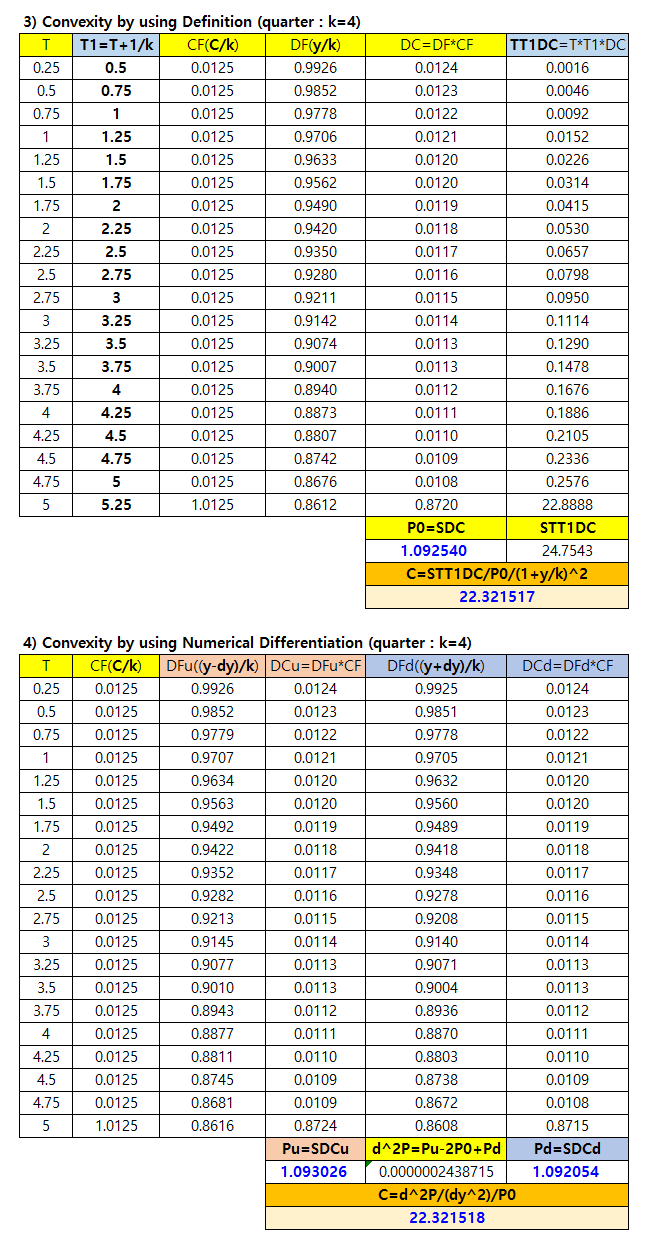
Bond Convexity in Excel and R
Bond duration is the first order linear approximation and thus does not consider a non-linearity. Making up for this shortcoming of the duration, a convexity is needed to describe the non-linearity of a bond price. This post explains the meaning and c...

ggplot tips: Using position_stack() for Individual Positioning
For a long time I have wondered why some people would use position_stack() for position alignment instead of the simpler version position = "stack".
Recently, though, I learned the purpose of the former approach when I tried to add data label...

Custom charting functions using ggplot2
While R has variety of options to choose from when it comes to 2D graphics and data visualisation, it is hard to beat ggplot2 in terms of features, functionality and overall visual quality. I wanted to share my take on how to use the package which is, ...

Copyright © 2022 | MH Corporate basic by MH Themes