
Thinks Another: Using Spectrograms to Identify Stage Wiggliness?
Want to share your content on R-bloggers? click here if you have a blog, or here if you don't.
Last night I started wondering about ways in which I might be able to use signal processing (Fourier analysis) or symbol dynamics (eg Thinks: Symbolic Dynamics for Categorising Rally Stage Wiggliness?) to help categorise the nature of rally stage twistiness.
Over a morning coffee break, I reminded myself of spectrograms, graphical devices that chunk a time series into a sequence of steps, and than display a frequency plot of each part. Which got me wondering: could I use a spectrogram to segment a stage route and analyse the spectrum of some signal taken along the route to identify wiggliness at that part of the stage?
If I’m reading it right, I think the following spectrogram does show some possible differences in wiggliness for different segments along the stage?
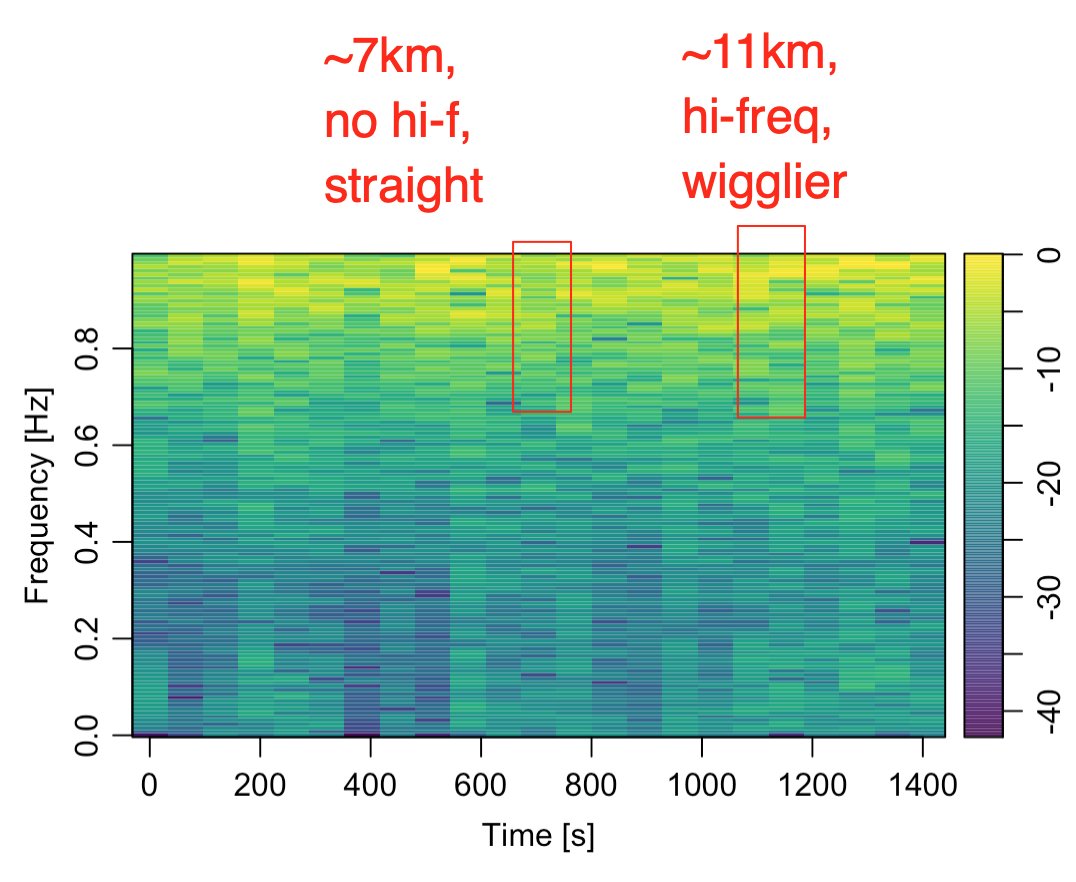
The question then becomes: what signal (as a function of distance along line) to use? The above spectrogram is based on the perpendicular distance of the route from the straight line connecting the start and end points of the route.
# trj is a trajr route
straight = st_linestring(data.matrix(rbind(head(trj[,c('x','y')], 1),
                                           tail(trj[,c('x','y')], 1))))

straight_sf = st_sfc(straight,
                     crs=st_crs(utm_routes))

trj_d = TrajRediscretize(trj, 10)
utm_discretised = trj_d %>%
                    sf::st_as_sf(coords = c("x","y")) %>%
                    sf::st_set_crs(st_crs(utm_routes[route_index,]))

# Get the rectified distance from the midline
# Can we also get whether it's to left or right?
perp_distances = data.frame(d_ = st_distance(utm_discretised,
                                             straight_sf))
# Returned distance is given as units
perp_distances$d = as.integer(perp_distances$d_)

perp_distances$i = 10 * (1:nrow(perp_distances))
#perp_distances$i = units::set_units(10 * (1:nrow(perp_distances)), 'm')
We can then do something like a low pass filter:
library(signal)

# High pass filter
bf <- butter(2, 0.9, type="high")
perp_distances$d_hi <- filter(bf, perp_distances$d)
and generate the spectrogram show above:
# We could just plot this direct
spec = specgram(perp_distances$d_hi)

# Or make pretty
# Via:https://hansenjohnson.org/post/spectrograms-in-r/
library(oce)
# discard phase information
P = abs(spec$S)

# normalize
P = P/max(P)

# convert to dB
P = 10*log10(P)

# config time axis
t = spec$t

# plot spectrogram
imagep(x = t,
       y = spec$f,
       z = t(P),
       col = oce.colorsViridis,
       ylab = 'Frequency [Hz]',
       xlab = 'Time [s]',
       drawPalette = T,
       decimate = F
)
However, it would possibly make more sense to use something line the angle of turn, convexity index, or radius of curvature at each 10m step as the signal…
Hmmm…
Related: Rapid ipywidgets Prototyping Using Third Party Javascript Packages in Jupyter Notebooks With jp_proxy_widget (example of a waversurfer.js spectrogram js app widgetised for use in Jupyter notebooks).

If you listen to that track it’s really interesting seeing how the imagery maps onto the sound. Eg in the above image you can see a lag in an edge between right and left channels towards the end of the trace, which translates to hearing an effect in the left channel echoed a moment later in the right.
Which makes me think: could I use telemetry from two drivers as left and right stereo tracks and try to sonify the telemetry differences between them using distance along stage as the x axis value and some mapping of different telemetry channels onto frequency…? For example, brake on the bass, throttle at the top, and lateral acceleration in the mid-range?
R-bloggers.com offers daily e-mail updates about R news and tutorials about learning R and many other topics. Click here if you're looking to post or find an R/data-science job.
Want to share your content on R-bloggers? click here if you have a blog, or here if you don't.