[This article was first published on R – TomazTsql, and kindly contributed to R-bloggers]. (You can report issue about the content on this page here)
Want to share your content on R-bloggers? click here if you have a blog, or here if you don't.
Want to share your content on R-bloggers? click here if you have a blog, or here if you don't.
Using pipe %>% or chaining commands is very intuitive for creating following set of commands for data preparation. Visualization library ggplot in this manner uses sign “+” (plus) to do all the chaining. What if we would have to replace with the pipe sign?
So image your typical ggplot command:
library(ggplot2)

#sample DataSet
iris <- iris
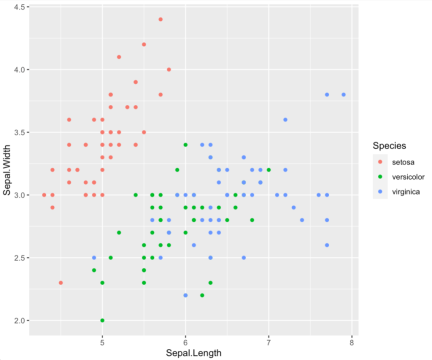
ggplot(iris, aes(Sepal.Length, Sepal.Width, colour = Species)) + geom_point()
Which produces a typical graph:
And for the sake of useless functionality, what if the ggplot command would have used a pipe? The code would look like:
gggplot(iris, aes(Sepal.Length, Sepal.Width, colour = Species))
              %>% geom_point()
              %>% theme_bw()
Pretty nifty and still very useless.
With the help of the “ToPipe” function, this can be achieved:
ToPipe <- function(ee) {
  this_fn <- rlang::call_name(ee)
  updated_args <- rlang::call_args(ee)

  if (identical(this_fn, "%>%") || length(updated_args)==0) {
    fn_2 <- rlang::call2("+", !!!updated_args)
    eval(fn_2)
  } else {
   eval(ee)
  }
}


### pipe version
fun <- quote(ggplot(iris, aes(Sepal.Length, Sepal.Width, colour = Species))
              %>% geom_point())
ToPipe(fun)
As always, code is available in at the Github in same Useless_R_function repository.
Happy R-coding!
To leave a comment for the author, please follow the link and comment on their blog: R – TomazTsql.
R-bloggers.com offers daily e-mail updates about R news and tutorials about learning R and many other topics. Click here if you're looking to post or find an R/data-science job.
Want to share your content on R-bloggers? click here if you have a blog, or here if you don't.


