Advent of 2020, Day 21 – Using Scala with Spark Core API in Azure Databricks
Want to share your content on R-bloggers? click here if you have a blog, or here if you don't.
Series of Azure Databricks posts:
- Dec 01: What is Azure Databricks
- Dec 02: How to get started with Azure Databricks
- Dec 03: Getting to know the workspace and Azure Databricks platform
- Dec 04: Creating your first Azure Databricks cluster
- Dec 05: Understanding Azure Databricks cluster architecture, workers, drivers and jobs
- Dec 06: Importing and storing data to Azure Databricks
- Dec 07: Starting with Databricks notebooks and loading data to DBFS
- Dec 08: Using Databricks CLI and DBFS CLI for file upload
- Dec 09: Connect to Azure Blob storage using Notebooks in Azure Databricks
- Dec 10: Using Azure Databricks Notebooks with SQL for Data engineering tasks
- Dec 11: Using Azure Databricks Notebooks with R Language for data analytics
- Dec 12: Using Azure Databricks Notebooks with Python Language for data analytics
- Dec 13: Using Python Databricks Koalas with Azure Databricks
- Dec 14: From configuration to execution of Databricks jobs
- Dec 15: Databricks Spark UI, Event Logs, Driver logs and Metrics
- Dec 16: Databricks experiments, models and MLFlow
- Dec 17: End-to-End Machine learning project in Azure Databricks
- Dec 18: Using Azure Data Factory with Azure Databricks
- Dec 19: Using Azure Data Factory with Azure Databricks for merging CSV files
- Dec 20: Orchestrating multiple notebooks with Azure Databricks
Yesterday we explored the capabilities of orchestrating notebooks in Azure Databricks. Also in previous days we have seen that Spark is the main glue between the different languages. But today we will talk about Scala.

And in the following blogposts we will explore the core engine and services on top:
- Spark SQL+ Dataframes
- Streaming
- MLlib – Machine learning library
- GraphX – Graph computations

Apache Spark is a powerful open-source processing engine built around speed, ease of use, and sophisticated analytics.
Spark Core is underlying general execution engine for the Spark Platform with all other functionalities built-in. It is in memory computing engine that provides variety of language support, as Scala, R, Python for easier data engineering development and machine learning development.
Spark has three key interfaces:
- Resilient Distributed Dataset (RDD) – It is an interface to a sequence of data objects that consist of one or more types that are located across a collection of machines (a cluster). RDDs can be created in a variety of ways and are the “lowest level” API available. While this is the original data structure for Apache Spark, you should focus on the DataFrame API, which is a superset of the RDD functionality. The RDD API is available in the Java, Python, and Scala languages.
- DataFrame – similar in concept to the DataFrame you will find with the pandas Python library and the R language. The DataFrame API is available in the Java, Python, R, and Scala languages.
- Dataset – is combination of RDD and DataFrame. It proved typed interface of RDD and gives you the convenience of the DataFrame. The Dataset API si available only for Scala and Java.
In general, when you will be working with the performance optimisations, either DataFrames or Datasets should be enough. But when going into more advanced components of Spark, it may be necessary to use RDDs. Also the visualisation within Spark UI references directly RDDs.
1.Datasets
Let us start with Databricks datasets, that are available within every workspace and are here mainly for test purposes. This is nothing new; both Python and R come with sample datasets. For example the Iris dataset that is available with Base R engine and Seaborn Python package. Same goes with Databricks and sample dataset can be found in /databricks-datasets folder.
Create a new notebook in your workspace and name it Day21_Scala. Language: Scala. And run the following Scala command.
display(dbutils.fs.ls("/databricks-datasets"))
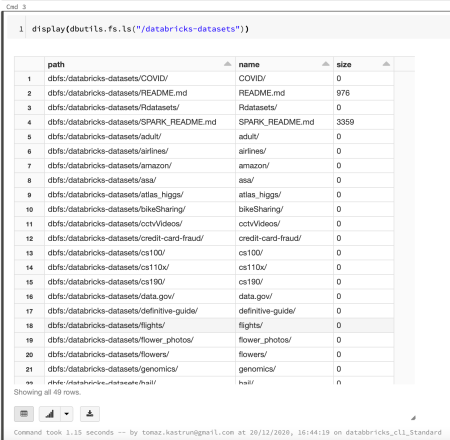
You can always store the results to variable and later use is multiple times:
// transformation
val textFile = spark.read.textFile("/databricks-datasets/samples/docs/README.md")
and listing the content of the variable by using show() function:
textFile.show()

And some other useful functions; to count all the lines in textfile, to show the first line and to filter the text file showing only the lines containing the search argument (word sudo).
// Count number or lines in textFile
textFile.count()
// Show the first line of the textFile
textFile.first()
// show all the lines with word Sudo
val linesWithSudo = textFile.filter(line => line.contains("sudo"))

And also printing all (first four) lines of with the subset of text containing the word “sudo”. In the second example finding the Line number with most words:
// Output the all four lines
linesWithSudo.collect().take(4).foreach(println)
// find the lines with most words
textFile.map(line => line.split(" ").size).reduce((a, b) => if (a > b) a else b)

2. Create a dataset
Now let’s create a dataset (remember the difference between Dataset and DataFrame) and load some data from /databricks-datasets folder.
val df = spark.read.json("/databricks-datasets/samples/people/people.json")
3. Convert Dataset to DataFrame
We can also convert Dataset to DataFrame for easier operation and usage. We must define a class that represents a type-specific Scala JVM object (like a schema) and now repeat the same process with definition.
case class Person (name: String, age: Long)
val ds = spark.read.json("/databricks-datasets/samples/people/people.json").as[Person]
We can also create and define another dataset, taken from the /databricks-datasets folder that is in JSON (flattened) format:
// define a case class that represents the device data.
case class DeviceIoTData (
  battery_level: Long,
  c02_level: Long,
  cca2: String,
  cca3: String,
  cn: String,
  device_id: Long,
  device_name: String,
  humidity: Long,
  ip: String,
  latitude: Double,
  longitude: Double,
  scale: String,
  temp: Long,
  timestamp: Long
)

val ds = spark.read.json("/databricks-datasets/iot/iot_devices.json").as[DeviceIoTData]

and run show() function to see the imported Dataset from JSON file:
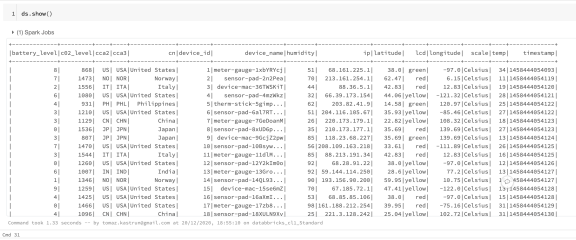
Now let’s play with the dataset using Scala Dataset API with following frequently used functions:
- display(),
- describe(),
- sum(),
- count(),
- select(),
- avg(),
- filter(),
- map() or where(),
- groupBy(),
- join(), and
- union().
display()
You can also view the dataset using display() (similar to .show() function):
display(ds)

describe()
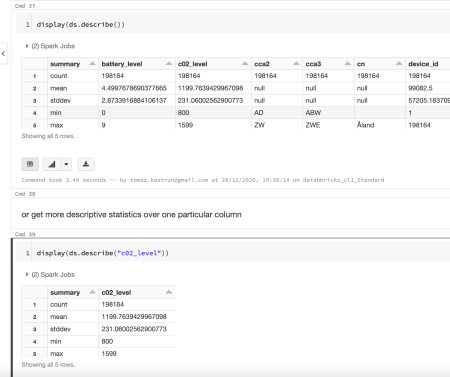
Describe() function is great for exploring the data and the structure of the data:
ds.describe()

or for getting descriptive statistics of the Dataset or of particular column:
display(ds.describe())
// or for column
display(ds.describe("c02_level"))
sum()
Let’s sum all c02_level values:
//create a variable sum_c02_1 and sum_c02_2;
// both are correct and return same results

val sum_c02_1 = ds.select("c02_level").groupBy().sum()
val sum_c02_2 = ds.groupBy().sum("c02_level")

display(sum_c02_1)

And we can also double check the result of this sum with SQL. Just because it is fun. But first We need to create a SQL view (or it could be a table) from this dataset.
ds.createOrReplaceTempView("SQL_iot_table")
And then define cell as SQL statement, using %sql. Remember, complete code today is written in Scala, unless otherwise stated with %{lang} and the beginning.
%sql
SELECT sum(c02_level) as Total_c02_level FROM SQL_iot_table

And for sure, we get the same result (!).
select()
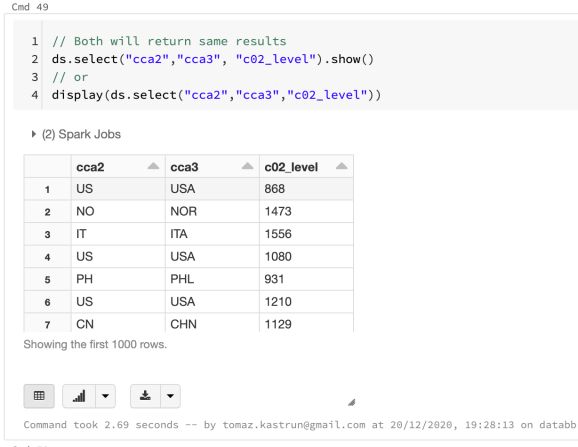
Select() function will let you show only the columns you want to see.
// Both will return same results
ds.select("cca2","cca3", "c02_level").show()
// or
display(ds.select("cca2","cca3","c02_level"))
avg()
Avg() function will let you aggregate a column (let us take: c02_level) over another column (let us take: countries in variable cca3). First we want to calculate average value over the complete dataset:
val avg_c02 = ds.groupBy().avg("c02_level")

display(avg_c02)
And then also the average value for each country:
val avg_c02_byCountry = ds.groupBy("cca3").avg("c02_level")

display(avg_c02_byCountry)

filter()
Filter() function will shorten or filter out the values that will not comply with the condition. Filter() function can also be replaced by where() function; they both have similar behaviour.
Following command will return dataset that meet the condition where batter_level is greater than 7.
display(ds.filter(d => d.battery_level > 7))
And the following command will filter the database on same condition, but only return the specify columns (in comparison with previous command which returned all columns):
display(ds.filter(d => d.battery_level > 7).select("battery_level", "c02_level", "cca3"))

groupBy()
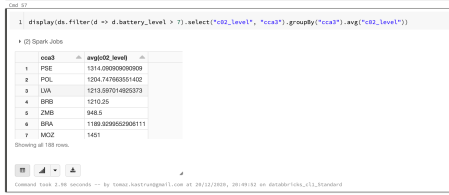
Adding aggregation to filtered data (avg() function) and grouping dataset based on cca3 variable:
display(ds.filter(d => d.battery_level > 7).select("c02_level", "cca3").groupBy("cca3").avg("c02_level"))
Note that there is explicit definition of internal subset in filter function. Part where “d => d.battery_level>7” is creating a separate subset of data that can also be used with map() function, as part of map-reduce Hadoop function.
join()
Join() function will combine two objects. So let us create two simple DataFrames and create a join between them.
val df_1 = Seq((0, "Tom"), (1, "Jones")).toDF("id", "first")
val df_2 = Seq((0, "Tom"), (2, "Jones"), (3, "Martin")).toDF("id", "second")
Using function Seq() to create a sequence and toDF() to save it as DataFrame.
To join two DataFrames, we use
display(df_1.join(df_2, "id"))
Name of the first DataFrame – df_1 (on left-hand side) joined by second DataFrame – df_2 (on the right-hand side) by a column “id”.

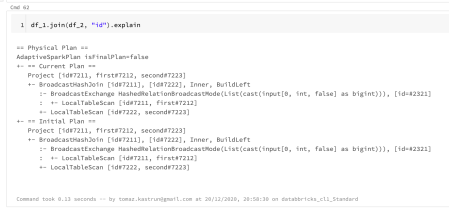
Join() implies inner.join and returns all the rows where there is a complete match. If interested, you can also explore the execution plan of this join by adding explain at the end of command:
df_1.join(df_2, "id").explain
and also create left/right join or any other semi-, anti-, cross- join.
df_1.join(df_2, Seq("id"), "LeftOuter").show
df_1.join(df_2, Seq("id"), "RightOuter").show

union()
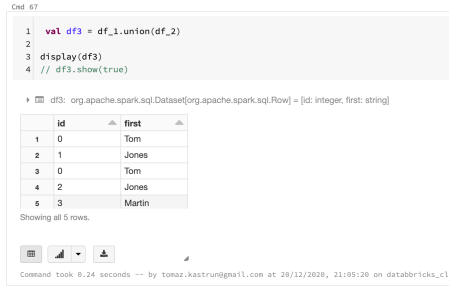
To append two datasets (or DataFrames), union() function can be used.
 val df3 = df_1.union(df_2)

display(df3)
// df3.show(true)
distinct()
Distinct() function will return only the unique values, and it can also be used with union() function to achieve union all type of behaviour:
display(df3.distinct())

Tomorrow we will Spark SQL and DataFrames with Spark Core API in Azure Databricks. Todays’ post was little bit longer, but it is important to get a good understanding on Spark API, get your hands wrapped around Scala and start working with Azure Databricks.
Complete set of code and Scala notebooks (including HTML) will be available at the Github repository.
Happy Coding and Stay Healthy!
R-bloggers.com offers daily e-mail updates about R news and tutorials about learning R and many other topics. Click here if you're looking to post or find an R/data-science job.
Want to share your content on R-bloggers? click here if you have a blog, or here if you don't.
